0.16.6 文档
全站目录 · 按任务查找
1.7 弦图综合展示
把四条基因组放在同一张关系图中,组合直线与弧形骨架、保留真实链方向的基因、连续相似度标度和精选标签,同时保留数据来源。
综合结果
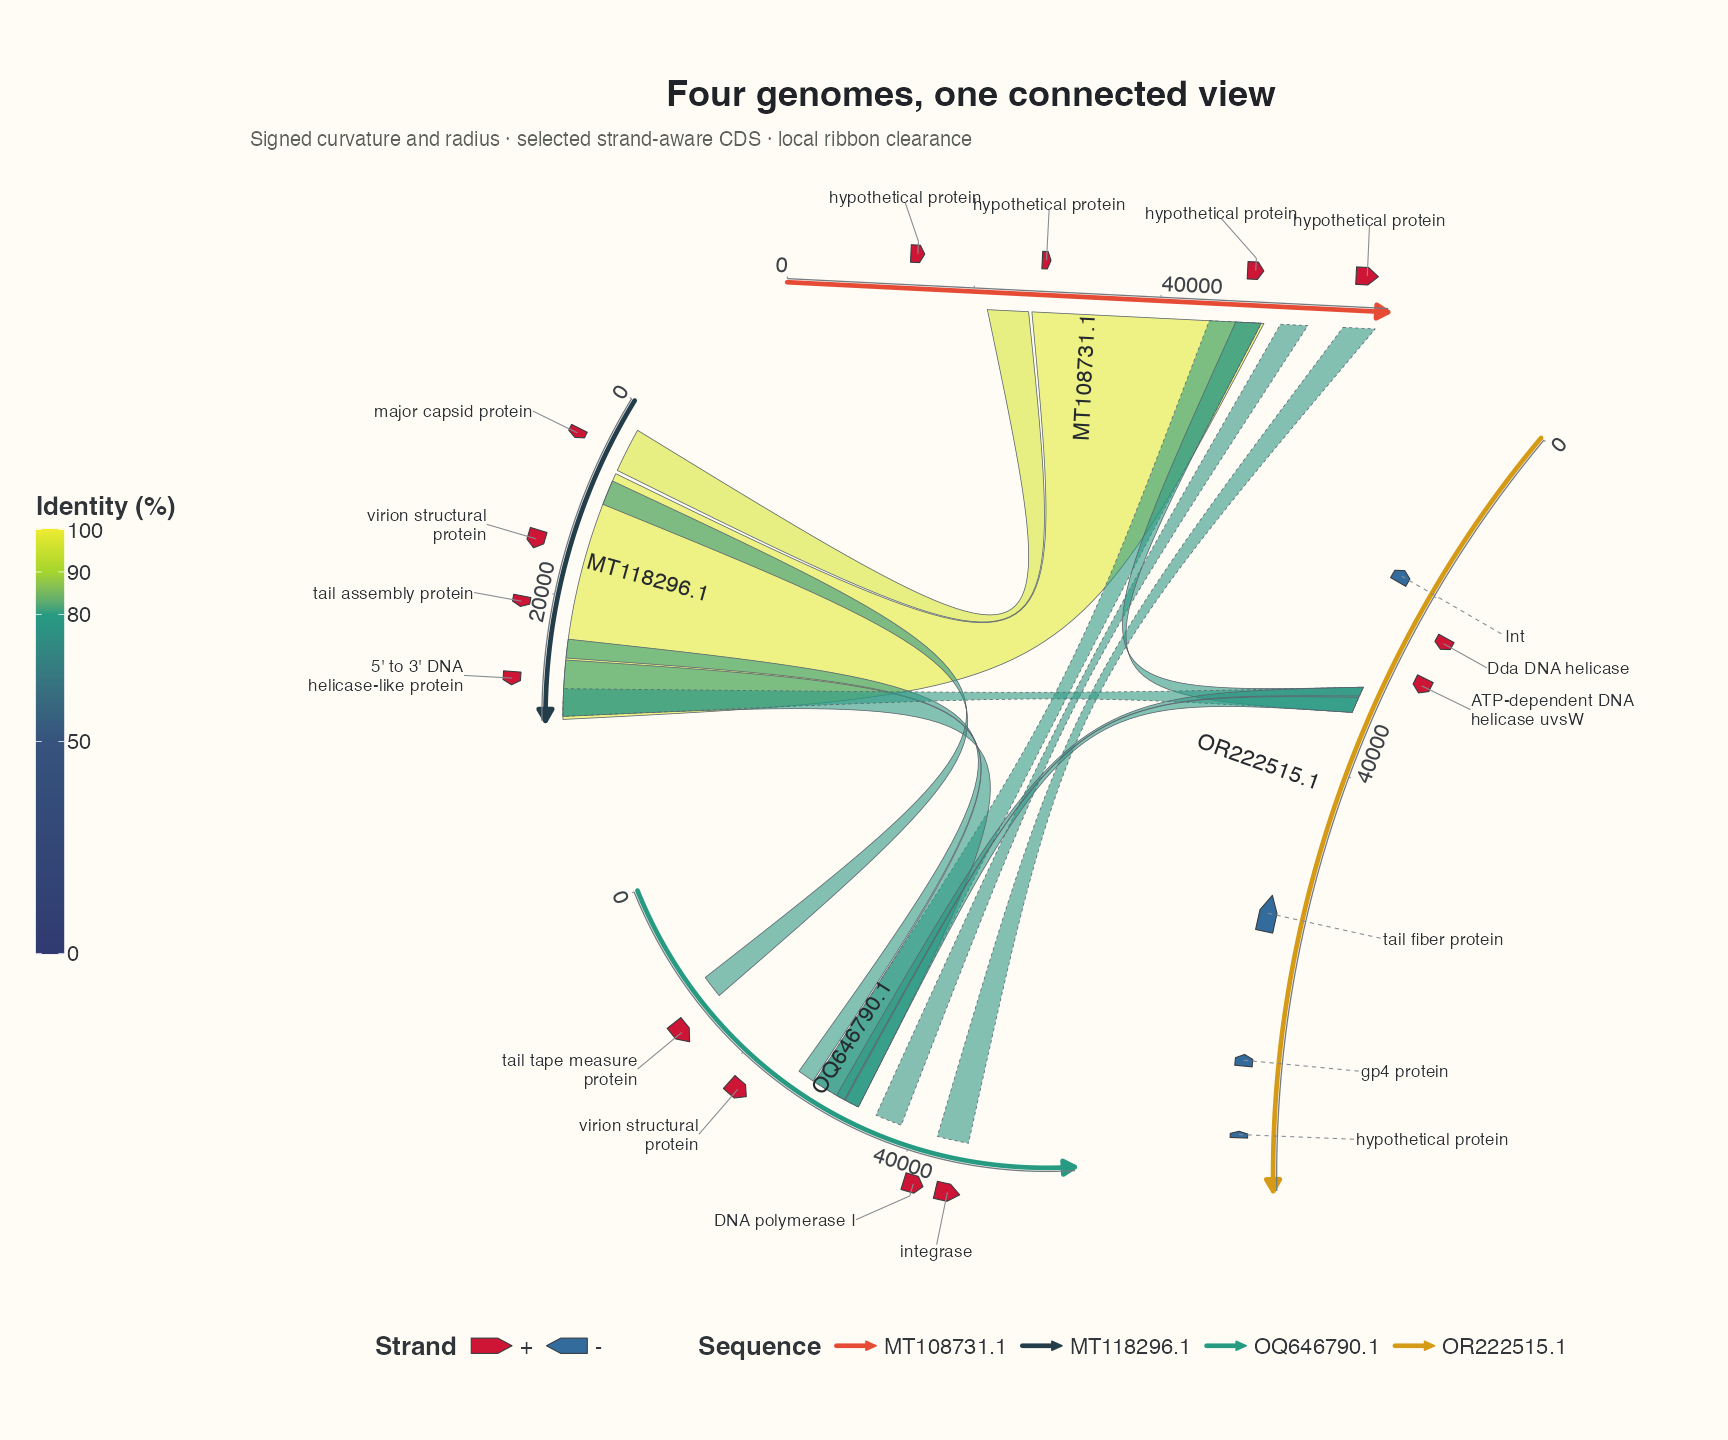
本页是模块一的终点。初学请按输入表 → 生成与导入 → 逐层绘图 → 参数与避障学习。四条真实序列上只展示18个精选CDS,每个均交给repel标签层,避免密集箭头淹没连接。
准备原始记录
将教程输入包解压到工作目录,使其包含 examples/。使用 install.packages(c("dplyr", "purrr", "tidyr")) 安装示例可选依赖;完整流程用它们整理表格和计算 GC 轨道。
准备代码 · 在本页运行一次
代码
# Optional appearance choices; none of these columns or scales is required input.
library(ggchord)
seq_palette <- setNames(
  c("#E64B35", "#233E4A", "#269B82", "#D59B17"),
  c("MT108731.1", "MT118296.1", "OQ646790.1", "OR222515.1")
)
gene_palette <- c("+" = "#CE1536", "-" = "#346B9D", "." = "#8291A6")

library(ggchord)
doc_background <- "#FFFCF5"
identity_palette <- c("#303B71", "#36537D", "#269B82", "#A5D52C", "#ECEB31")
identity_values <- c(0, 0.5, 0.8, 0.9, 1)
identity_breaks <- c(0, 50, 80, 90, 100)
doc_legend_theme <- theme(
  legend.title = element_text(size = 13, face = "bold"),
  legend.text = element_text(size = 11),
  legend.key.width = unit(9, "mm"), legend.key.height = unit(5, "mm"),
  legend.spacing.x = unit(9, "mm"), legend.spacing.y = unit(7, "mm"),
  legend.margin = margin(l = 4, r = 4, unit = "mm")
)
sequence_guide <- guide_ggchord_legend(nrow = 1, theme = doc_legend_theme)
strand_guide <- guide_ggchord_legend(
  nrow = 1, override.aes = list(strand = c("+", "-")), theme = doc_legend_theme
)
identity_guide <- guide_ggchord_colourbar(
  position = "left", direction = "vertical",
  theme = theme(
    legend.key.height = unit(75, "mm"), legend.key.width = unit(5, "mm"),
    legend.title = element_text(size = 13, face = "bold"),
    legend.text = element_text(size = 11), legend.margin = margin(r = 7, unit = "mm")
  )
)
doc_theme <- theme_ggchord_publication(
  axis.text = element_text(size = 11),
  axis.text.check.overlap = TRUE
) +
  theme(
    legend.position = "bottom",
    legend.title = element_text(size = 13, face = "bold"),
    legend.text = element_text(size = 11),
    legend.key.width = unit(9, "mm"), legend.key.height = unit(5, "mm"),
    legend.spacing.x = unit(9, "mm"), legend.spacing.y = unit(7, "mm"),
    legend.box.spacing = unit(6, "mm"),
    plot.background = element_rect(fill = doc_background, colour = NA),
    panel.background = element_blank(),
    plot.title = element_text(face = "bold", size = 18),
    plot.subtitle = element_text(size = 10, colour = "#5C625A"),
    plot.margin = margin(14, 18, 14, 18)
  )
doc_axis <- function(coordinates = "relative") {
  scale_seq_position_continuous(
    coordinates = coordinates, n.breaks = 3, minor_breaks = NULL,
    labels = function(x) format(x, scientific = FALSE, big.mark = ",", trim = TRUE)
  )
}
代码
library(ggchord)
library(dplyr)
library(purrr)
library(tidyr)
# Original repository records; extract the tutorial input bundle first.
show_sequences <- read_fasta_lengths(files = "examples/fasta/*.fna") |>
  select(accver, length)
show_annotations <- read_gff3(files = "examples/gff3/*.gff3", unstranded = "keep")
show_genes <- show_annotations |>
  filter(type == "CDS") |>
  select(accver, start, end, strand, anno)
show_alignments <- read_blast(files = "examples/blastn-standard/*.tsv")
# At most three substantial observed HSPs per pair; no coordinates are invented.
show_links <- show_alignments |>
  filter(length >= 900, pident >= 75) |>
  group_by(qaccver, saccver) |>
  slice_max(length, n = 3, with_ties = FALSE) |>
  ungroup()
# Select up to four source CDS per sequence, spread across annotation order.
# No feature is moved or invented; keep complete source tables separately.
show_features <- show_genes |>
  filter(end - start + 1 >= 500) |>
  group_by(accver) |>
  arrange(start, .by_group = TRUE) |>
  mutate(display_bin = ntile(row_number(), 4), informative = !is.na(anno) & anno != "hypothetical protein") |>
  group_by(accver, display_bin) |>
  arrange(desc(informative), desc(end - start), .by_group = TRUE) |>
  slice_head(n = 1) |>
  ungroup() |>
  select(accver, start, end, strand, anno)
# Also retain well-separated negative-strand CDS, if not already represented.
show_reverse <- show_genes |>
  filter(strand == "-", end - start + 1 >= 500) |>
  group_by(accver) |>
  arrange(start, .by_group = TRUE) |>
  slice(c(1, n())) |>
  ungroup()
show_features <- bind_rows(show_features, show_reverse) |>
  distinct(accver, start, end, strand, .keep_all = TRUE) |>
  arrange(accver, start)
show_labels <- show_features
show_optimization <- optimize_ggchord_layout(
  show_sequences, show_links,
  optimize = "orientation", weight = "length"
)
输入包含四条未改写的 FASTA、对应 GFF3 注释和 32 条原始 HSP。展示保留长度至少 900 bp、相似度至少 75% 的 HSP,每对序列最多三条,以减少拥挤;没有合并或编造比对。
组合图层
代码
show_curvature <- c(
  "MT108731.1" = 0, "MT118296.1" = 0.85,
  "OQ646790.1" = 1.1, "OR222515.1" = -0.4
)
show_radius <- c(
  "MT108731.1" = 1, "MT118296.1" = 1.05,
  "OQ646790.1" = 0.95, "OR222515.1" = 1.08
)
p_show_chord <- ggchord(show_sequences, show_links, show_features) +
  geom_link_ribbon(aes(ribbon_fill = pident), link_avoid = "smooth", alpha = 0.58, linewidth = 0.18) +
  geom_seq(
    seq_orientation = show_optimization$seq_orientation,
    seq_curvature = show_curvature, seq_radius = show_radius,
    seq_gap = 0.06, linewidth = 1.1
  ) +
  geom_gene(position = position_strand(0.07), width = 0.035) +
  geom_gene_label_repel(
    data = show_labels, label_layout = "radial", label_wrap = 24,
    size = 3.1, label_max_lines = 3, position = position_strand(0.07)
  ) +
  geom_seq_label(size = 4, seq_label_radius = 0.84, seq_label_hjust = 0.5) +
  scale_seq_colour_manual(
    values = seq_palette, name = "Sequence",
    guide = sequence_guide
  ) +
  scale_gene_fill_manual(values = gene_palette, breaks = c("+", "-"), name = "Strand") +
  scale_ribbon_fill_gradientn(
    colours = identity_palette, values = identity_values,
    limits = c(0, 100), breaks = identity_breaks, name = "Identity (%)", guide = identity_guide
  ) +
  guides(gene_fill = strand_guide) +
  scale_seq_position_continuous(breaks = c(0, 20000, 40000), minor_breaks = NULL) +
  coord_chord(rotation = 50) +
  doc_theme +
  labs(
    title = "Four genomes, one connected view",
    subtitle = "Signed curvature and radius · selected strand-aware CDS · local ribbon clearance"
  )
p_show_chord
geom_seq(seq_curvature = ...) 通过命名向量将曲率绑定到稳定的序列标识,0 表示直线。曲率只改变展示几何,不改变序列长度、生物学链方向或比对端点。
阅读与调整
先看序列颜色和基因方向,再沿较大的比对区间阅读连接。连接交叉本身不能证明重排。相似度色条与共线性视图使用相同范围和配色。
需要减少连接时查看连接筛选,调整文字密度时查看标签,改变半径和曲率时查看逐序列参数。从文件读取开始学习可先看真实序列比较。
按预定尺寸保存
代码
ggsave("four-genome-chord.png", p_show_chord, width = 12, height = 10, units = "in", dpi = 144)