Site guide · find your task
1.7 Complete chord showcase
On this page
What this view shows
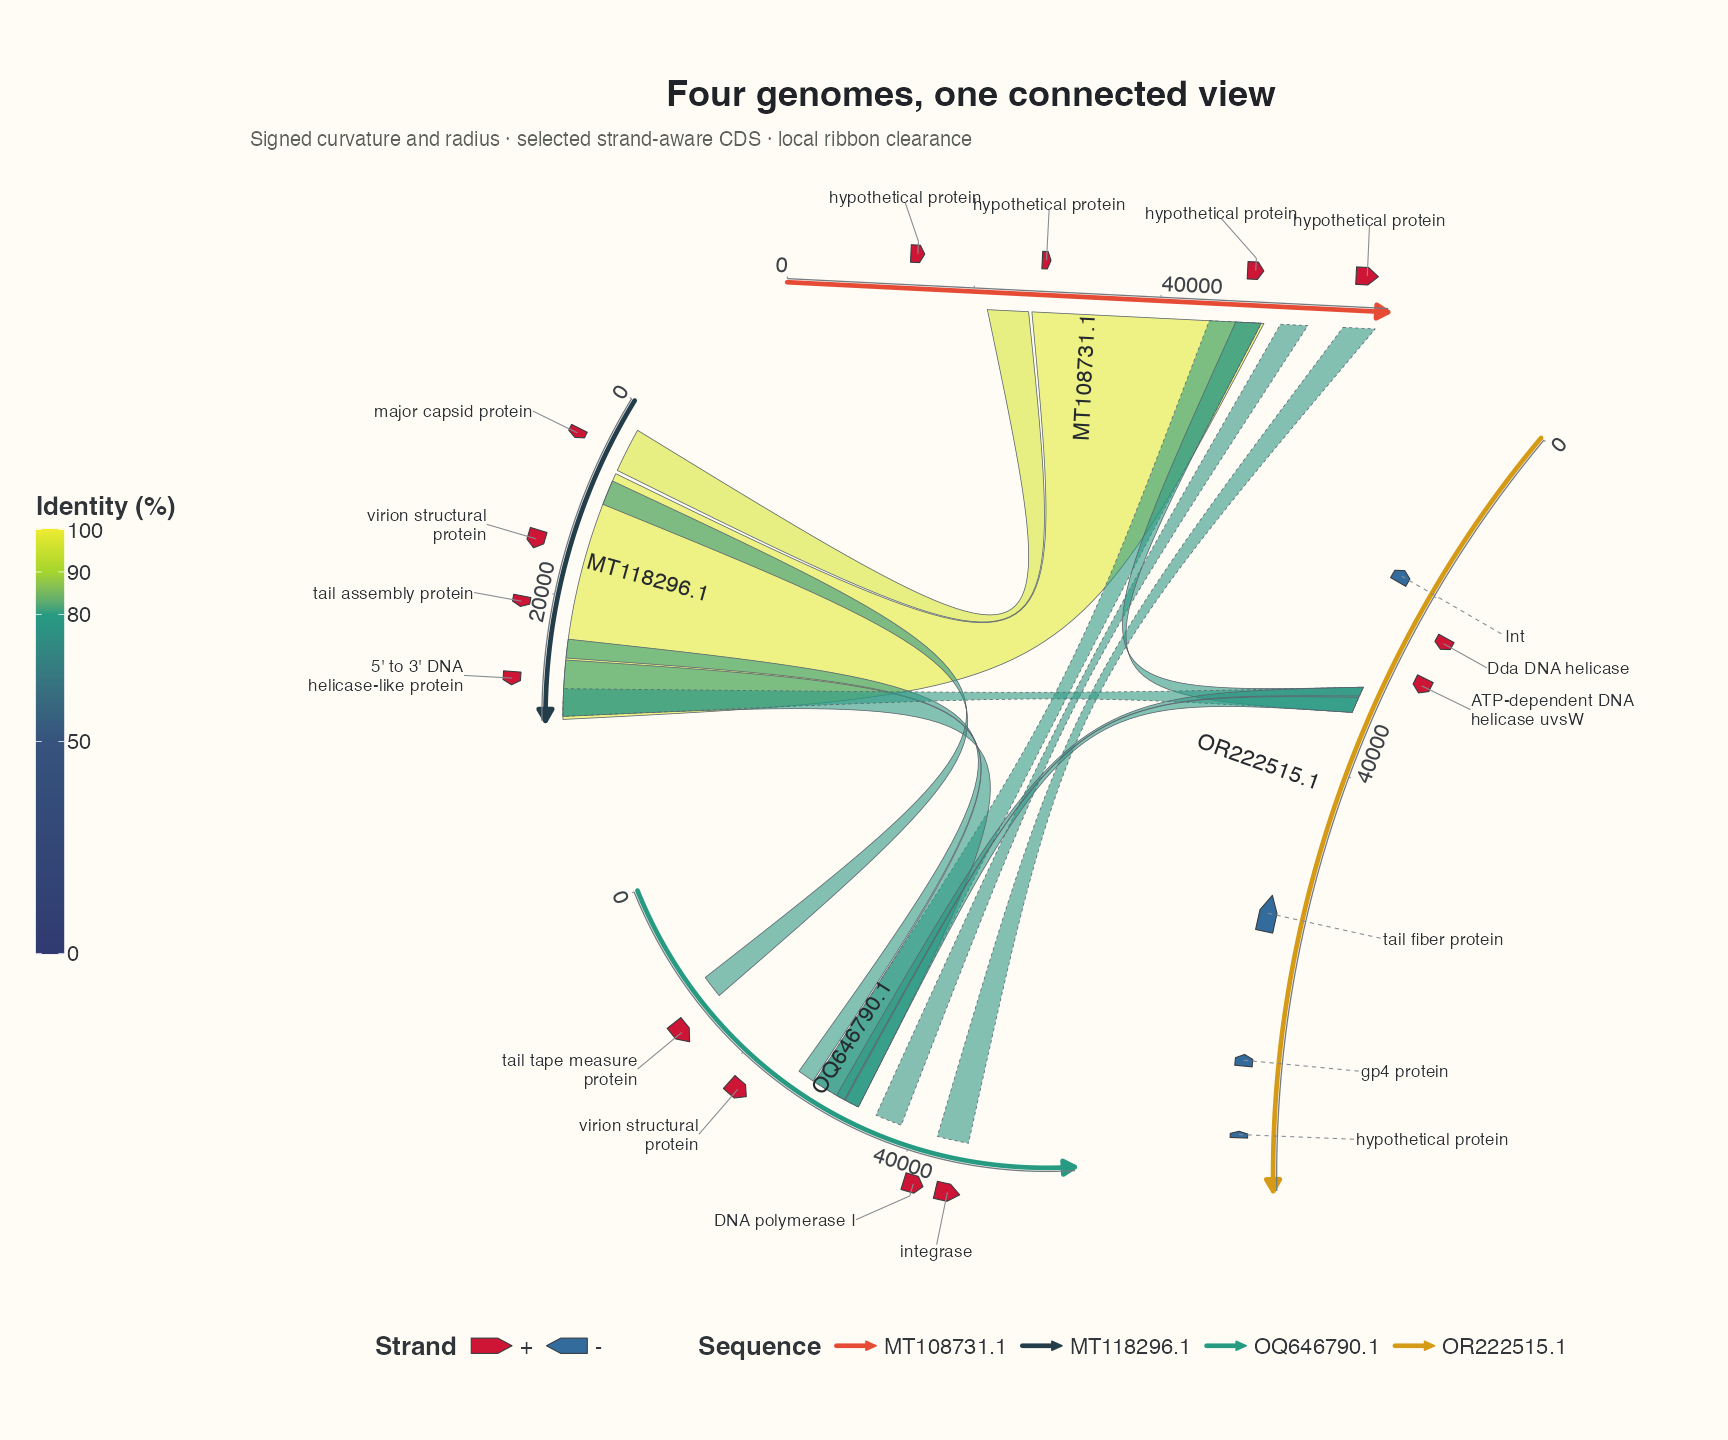
This is the end of Module I. Begin with tables, import, layer construction and geometry/clearance. 18 selected real CDS each receive repel labels; the complete 266-row annotation source remains separate. The four backbones combine zero, positive and negative curvature, varying radii and optimized display directions.
Prepare original records
Extract the tutorial input bundle into the working directory, so it contains examples/. Install the optional example packages with install.packages(c("dplyr", "purrr", "tidyr")); they prepare tables, map lists and inspect endpoint columns.
Preparation code — run once on this page
Code
# Optional appearance choices; none of these columns or scales is required input.
library(ggchord)
seq_palette <- setNames(
  c("#E64B35", "#233E4A", "#269B82", "#D59B17"),
  c("MT108731.1", "MT118296.1", "OQ646790.1", "OR222515.1")
)
gene_palette <- c("+" = "#CE1536", "-" = "#346B9D", "." = "#8291A6")

library(ggchord)
doc_background <- "#FFFCF5"
identity_palette <- c("#303B71", "#36537D", "#269B82", "#A5D52C", "#ECEB31")
identity_values <- c(0, 0.5, 0.8, 0.9, 1)
identity_breaks <- c(0, 50, 80, 90, 100)
doc_legend_theme <- theme(
  legend.title = element_text(size = 13, face = "bold"),
  legend.text = element_text(size = 11),
  legend.key.width = unit(9, "mm"), legend.key.height = unit(5, "mm"),
  legend.spacing.x = unit(9, "mm"), legend.spacing.y = unit(7, "mm"),
  legend.margin = margin(l = 4, r = 4, unit = "mm")
)
sequence_guide <- guide_ggchord_legend(nrow = 1, theme = doc_legend_theme)
strand_guide <- guide_ggchord_legend(
  nrow = 1, override.aes = list(strand = c("+", "-")), theme = doc_legend_theme
)
identity_guide <- guide_ggchord_colourbar(
  position = "left", direction = "vertical",
  theme = theme(
    legend.key.height = unit(75, "mm"), legend.key.width = unit(5, "mm"),
    legend.title = element_text(size = 13, face = "bold"),
    legend.text = element_text(size = 11), legend.margin = margin(r = 7, unit = "mm")
  )
)
doc_theme <- theme_ggchord_publication(
  axis.text = element_text(size = 11),
  axis.text.check.overlap = TRUE
) +
  theme(
    legend.position = "bottom",
    legend.title = element_text(size = 13, face = "bold"),
    legend.text = element_text(size = 11),
    legend.key.width = unit(9, "mm"), legend.key.height = unit(5, "mm"),
    legend.spacing.x = unit(9, "mm"), legend.spacing.y = unit(7, "mm"),
    legend.box.spacing = unit(6, "mm"),
    plot.background = element_rect(fill = doc_background, colour = NA),
    panel.background = element_blank(),
    plot.title = element_text(face = "bold", size = 18),
    plot.subtitle = element_text(size = 10, colour = "#5C625A"),
    plot.margin = margin(14, 18, 14, 18)
  )
doc_axis <- function(coordinates = "relative") {
  scale_seq_position_continuous(
    coordinates = coordinates, n.breaks = 3, minor_breaks = NULL,
    labels = function(x) format(x, scientific = FALSE, big.mark = ",", trim = TRUE)
  )
}
Code
library(ggchord)
library(dplyr)
library(purrr)
library(tidyr)
# Original repository records; extract the tutorial input bundle first.
show_sequences <- read_fasta_lengths(files = "examples/fasta/*.fna") |>
  select(accver, length)
show_annotations <- read_gff3(files = "examples/gff3/*.gff3", unstranded = "keep")
show_genes <- show_annotations |>
  filter(type == "CDS") |>
  select(accver, start, end, strand, anno)
show_alignments <- read_blast(files = "examples/blastn-standard/*.tsv")
# At most three substantial observed HSPs per pair; no coordinates are invented.
show_links <- show_alignments |>
  filter(length >= 900, pident >= 75) |>
  group_by(qaccver, saccver) |>
  slice_max(length, n = 3, with_ties = FALSE) |>
  ungroup()
# Select up to four source CDS per sequence, spread across annotation order.
# No feature is moved or invented; keep complete source tables separately.
show_features <- show_genes |>
  filter(end - start + 1 >= 500) |>
  group_by(accver) |>
  arrange(start, .by_group = TRUE) |>
  mutate(display_bin = ntile(row_number(), 4), informative = !is.na(anno) & anno != "hypothetical protein") |>
  group_by(accver, display_bin) |>
  arrange(desc(informative), desc(end - start), .by_group = TRUE) |>
  slice_head(n = 1) |>
  ungroup() |>
  select(accver, start, end, strand, anno)
# Also retain well-separated negative-strand CDS, if not already represented.
show_reverse <- show_genes |>
  filter(strand == "-", end - start + 1 >= 500) |>
  group_by(accver) |>
  arrange(start, .by_group = TRUE) |>
  slice(c(1, n())) |>
  ungroup()
show_features <- bind_rows(show_features, show_reverse) |>
  distinct(accver, start, end, strand, .keep_all = TRUE) |>
  arrange(accver, start)
show_labels <- show_features
show_optimization <- optimize_ggchord_layout(
  show_sequences, show_links,
  optimize = "orientation", weight = "length"
)
The input contains four unchanged FASTA records, their GFF3 annotations and 32 original HSPs. The display keeps HSPs at least 900 bp long and at least 75% identical, with at most three per sequence pair. This reduces clutter without merging or inventing alignments.
Compose the layers
Code
show_curvature <- c(
  "MT108731.1" = 0, "MT118296.1" = 0.85,
  "OQ646790.1" = 1.1, "OR222515.1" = -0.4
)
show_radius <- c(
  "MT108731.1" = 1, "MT118296.1" = 1.05,
  "OQ646790.1" = 0.95, "OR222515.1" = 1.08
)
p_show_chord <- ggchord(show_sequences, show_links, show_features) +
  geom_link_ribbon(aes(ribbon_fill = pident), link_avoid = "smooth", alpha = 0.58, linewidth = 0.18) +
  geom_seq(
    seq_orientation = show_optimization$seq_orientation,
    seq_curvature = show_curvature, seq_radius = show_radius,
    seq_gap = 0.06, linewidth = 1.1
  ) +
  geom_gene(position = position_strand(0.07), width = 0.035) +
  geom_gene_label_repel(
    data = show_labels, label_layout = "radial", label_wrap = 24,
    size = 3.1, label_max_lines = 3, position = position_strand(0.07)
  ) +
  geom_seq_label(size = 4, seq_label_radius = 0.84, seq_label_hjust = 0.5) +
  scale_seq_colour_manual(
    values = seq_palette, name = "Sequence",
    guide = sequence_guide
  ) +
  scale_gene_fill_manual(values = gene_palette, breaks = c("+", "-"), name = "Strand") +
  scale_ribbon_fill_gradientn(
    colours = identity_palette, values = identity_values,
    limits = c(0, 100), breaks = identity_breaks, name = "Identity (%)", guide = identity_guide
  ) +
  guides(gene_fill = strand_guide) +
  scale_seq_position_continuous(breaks = c(0, 20000, 40000), minor_breaks = NULL) +
  coord_chord(rotation = 50) +
  doc_theme +
  labs(
    title = "Four genomes, one connected view",
    subtitle = "Signed curvature and radius · selected strand-aware CDS · local ribbon clearance"
  )
p_show_chord
geom_seq(seq_curvature = ...) applies named values to stable sequence identifiers. 0 is a straight backbone. Curvature changes the display geometry; it does not alter sequence lengths, biological strands or alignment endpoints.
Read and adapt the result
Start with the sequence colours and gene directions, then trace the larger aligned intervals. A ribbon crossing is not evidence of a rearrangement by itself. The colour bar uses the same identity scale as the collinear view.
Use link filtering to change the display threshold, labels to choose annotation density, or sequence parameters to change radius and curvature. For a file-by-file introduction, start with original sequence comparisons.
Save at its intended size
Code
ggsave("four-genome-chord.png", p_show_chord, width = 12, height = 10, units = "in", dpi = 144)