Site guide · find your task
1.6 Full source-file workflow
On this page
Combine original FASTA, GFF3 and standard BLAST tables into a traceable comparison. Inspect inputs, choose a display subset, then compare chord and full-length views.
Prepare this page
In a fresh R session, run the code below, then follow this page in order. Colours and layout are optional display choices; inputs select only the fields needed. For file-based examples, first extract the input bundle so the working directory contains examples/.
Preparation code — run once on this page
Code
# Optional appearance choices; none of these columns or scales is required input.
library(ggchord)
seq_palette <- setNames(
  c("#E64B35", "#233E4A", "#269B82", "#D59B17"),
  c("MT108731.1", "MT118296.1", "OQ646790.1", "OR222515.1")
)
gene_palette <- c("+" = "#CE1536", "-" = "#346B9D", "." = "#8291A6")

library(ggchord)
doc_background <- "#FFFCF5"
identity_palette <- c("#303B71", "#36537D", "#269B82", "#A5D52C", "#ECEB31")
identity_values <- c(0, 0.5, 0.8, 0.9, 1)
identity_breaks <- c(0, 50, 80, 90, 100)
doc_legend_theme <- theme(
  legend.title = element_text(size = 13, face = "bold"),
  legend.text = element_text(size = 11),
  legend.key.width = unit(9, "mm"), legend.key.height = unit(5, "mm"),
  legend.spacing.x = unit(9, "mm"), legend.spacing.y = unit(7, "mm"),
  legend.margin = margin(l = 4, r = 4, unit = "mm")
)
sequence_guide <- guide_ggchord_legend(nrow = 1, theme = doc_legend_theme)
strand_guide <- guide_ggchord_legend(
  nrow = 1, override.aes = list(strand = c("+", "-")), theme = doc_legend_theme
)
identity_guide <- guide_ggchord_colourbar(
  position = "left", direction = "vertical",
  theme = theme(
    legend.key.height = unit(75, "mm"), legend.key.width = unit(5, "mm"),
    legend.title = element_text(size = 13, face = "bold"),
    legend.text = element_text(size = 11), legend.margin = margin(r = 7, unit = "mm")
  )
)
doc_theme <- theme_ggchord_publication(
  axis.text = element_text(size = 11),
  axis.text.check.overlap = TRUE
) +
  theme(
    legend.position = "bottom",
    legend.title = element_text(size = 13, face = "bold"),
    legend.text = element_text(size = 11),
    legend.key.width = unit(9, "mm"), legend.key.height = unit(5, "mm"),
    legend.spacing.x = unit(9, "mm"), legend.spacing.y = unit(7, "mm"),
    legend.box.spacing = unit(6, "mm"),
    plot.background = element_rect(fill = doc_background, colour = NA),
    panel.background = element_blank(),
    plot.title = element_text(face = "bold", size = 18),
    plot.subtitle = element_text(size = 10, colour = "#5C625A"),
    plot.margin = margin(14, 18, 14, 18)
  )
doc_axis <- function(coordinates = "relative") {
  scale_seq_position_continuous(
    coordinates = coordinates, n.breaks = 3, minor_breaks = NULL,
    labels = function(x) format(x, scientific = FALSE, big.mark = ",", trim = TRUE)
  )
}
This complete workflow uses four sequence records already present in the source repository. It requires the matching development checkout or the tutorial input bundle, not new alignments or external gene prediction. Download the inputs and unpack them so examples/ is under the working directory. Record the package version and build manifest with the exported figure.
1. Read and inspect original records
Code
library(dplyr)
sequence_source <- read_fasta_lengths(files = "examples/fasta/*.fna", source_file = TRUE)
seq_real <- sequence_source |>
  select(accver, length)
annotation_source <- read_gff3(files = "examples/gff3/*.gff3", unstranded = "keep", source_file = TRUE)
feature_real <- annotation_source |>
  select(accver, start, end, strand, type, anno)
alignment_source <- read_blast(files = "examples/blastn-standard/*.tsv", source_file = TRUE)
link_real <- alignment_source |>
  select(qaccver, saccver, qstart, qend, sstart, send, pident, length)
real_validation <- validate_ggchord_data(seq_real, link_real)
real_validation
The FASTA headers supply exact accession versions and lengths. GFF3 contributes CDS intervals and their original strands. BLAST output contributes existing alignments; the reader does not run BLAST. Inspect real_validation before continuing: decreasing link endpoints can be legitimate reverse-direction hits. Never turn unknown annotation strands into + to make a gene shortcut accept them.
2. Make the display selection explicit
Code
real_prepared <- prepare_ggchord_data(seq_real, link_real,
  features = list(annotation = feature_real)
)
real_filtered <- filter_ggchord_ribbons(link_real, min_pident = 80, min_length = 500)
# Explicit display subset: the six longest CDS per sequence; raw annotations stay intact.
real_display_features <- feature_real |>
  group_by(accver) |>
  slice_max(end - start + 1, n = 6, with_ties = FALSE) |>
  ungroup()
real_labels <- real_display_features |>
  filter(anno != "hypothetical protein") |>
  group_by(accver) |>
  slice_head(n = 2) |>
  ungroup()
real_filtered$report| Metric | Observed output |
|---|---|
| Sequences | 4 |
| Annotation rows | 266 |
| CDS selected for the chord view | 24 |
| Original HSPs | 32 |
| HSPs retained by the display filter | 8 |
| Selected text labels | 6 |
The link display retains identity ≥80% and reported alignment length ≥500 bp. The chord view selects the six longest imported CDS per sequence, labelling at most two selected CDS with informative annotations (excluding hypothetical protein). These are display rules, not biological findings or a claim that omitted genes are absent. Raw feature_real and link_real remain intact; real_prepared$report and real_filtered$report retain preparation/filter evidence. No display strands are recoded. This differs from the small packaged teaching fixture whose documented generation includes display-strand recoding.
3. Build a chord comparison
Code
p_real_chord <- ggchord(seq_data = seq_real, ribbon_data = real_filtered$data, validate = "none") +
  geom_link_ribbon(aes(ribbon_fill = pident), alpha = .65) +
  geom_seq(show.legend = FALSE) +
  geom_feature(aes(feature_fill = strand),
    data = real_display_features,
    width = .045, position = position_strand(.08)
  ) +
  geom_feature_label_repel(
    data = real_labels, label_layout = "radial",
    label_wrap = 20, size = 4, position = position_strand(.08)
  ) +
  geom_seq_label(size = 4, seq_label_radius = .84, seq_label_hjust = .5) +
  coord_chord() +
  scale_seq_colour_manual(values = seq_palette) +
  scale_feature_fill_manual(values = gene_palette, breaks = c("+", "-")) +
  scale_ribbon_fill_gradientn(
    colours = identity_palette, values = identity_values,
    limits = c(0, 100), breaks = identity_breaks, name = "Identity (%)", guide = identity_guide
  ) +
  doc_theme
p_real_chord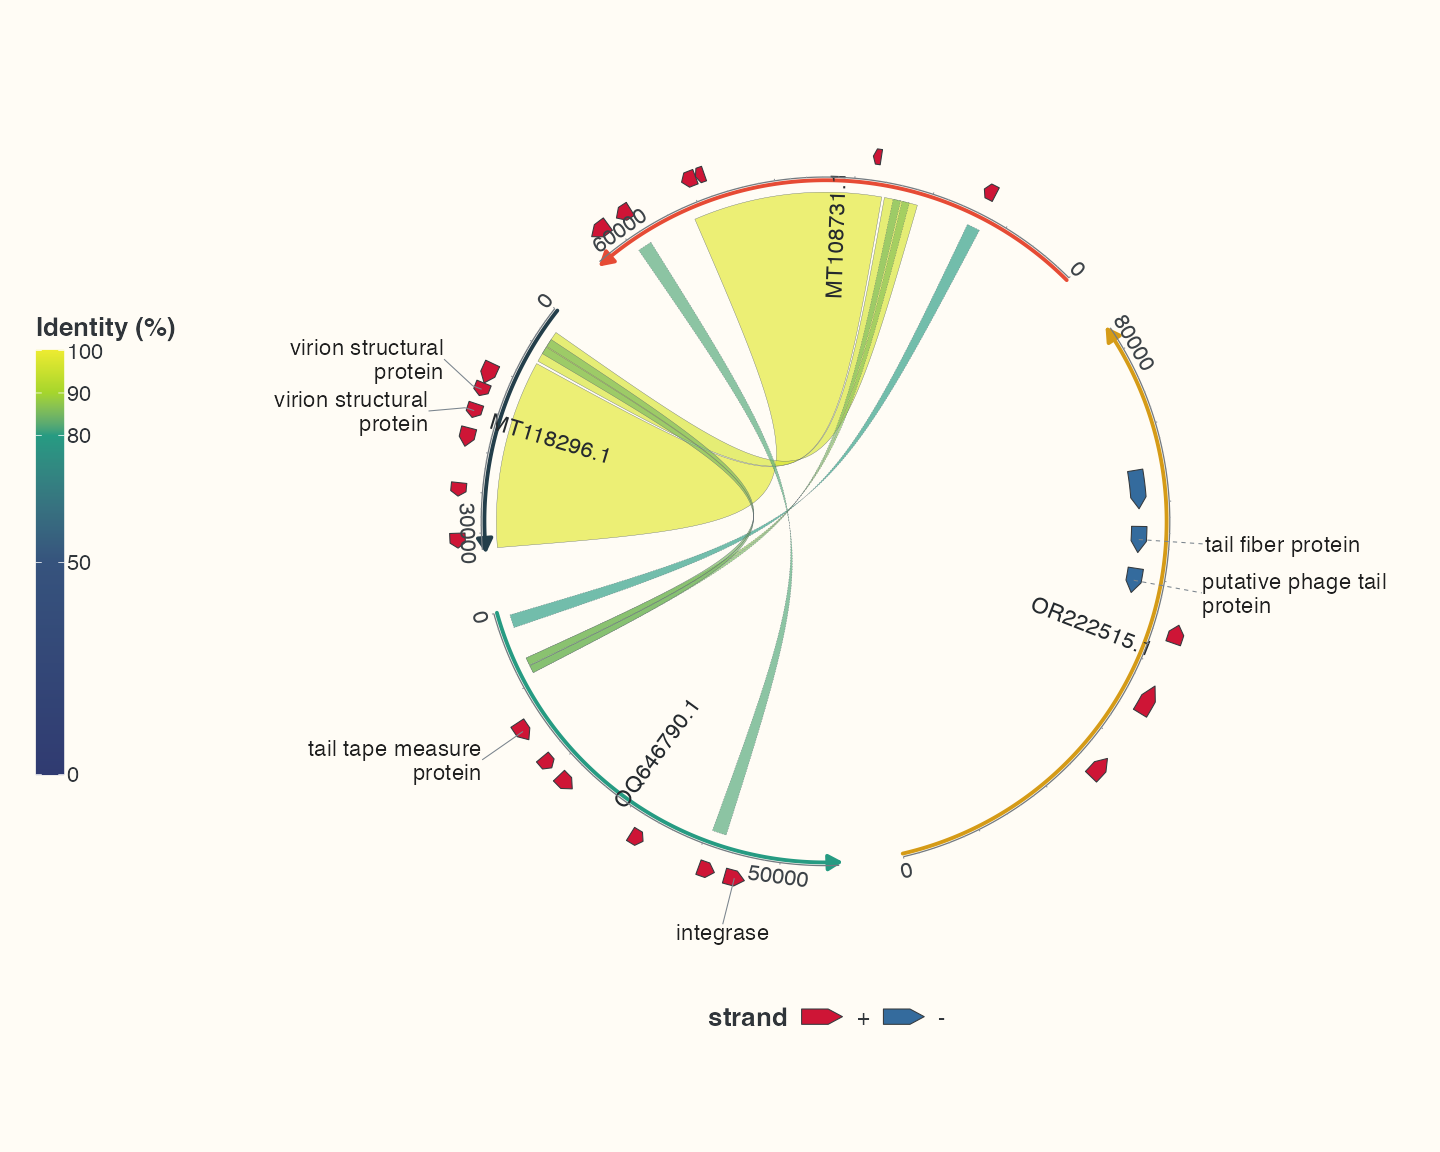
Read sequence labels first, then source-strand feature arrows and interval links. Ribbons encode existing aligned intervals and mapped identity; their crossing is not itself evidence of a rearrangement. The selected features remain visibly separate from the much wider alignment spans. Use the full input tables when scientific interpretation needs annotations outside this display subset.
4. Inspect all annotations in a linear view
Code
p_real_linear <- ggchord(seq_real, real_filtered$data, validate = "none") +
  geom_link_ribbon(fill = "#6BAFA6", alpha = .45) +
  geom_seq() +
  geom_seq_label(size = 4) +
  geom_feature(data = feature_real, feature_fill = "#CE1536", show.legend = FALSE, position = position_strand(.18)) +
  geom_seq_scale(length = 10000) +
  coord_collinear() +
  doc_axis() +
  scale_seq_colour_manual(values = seq_palette) +
  doc_theme
p_real_linear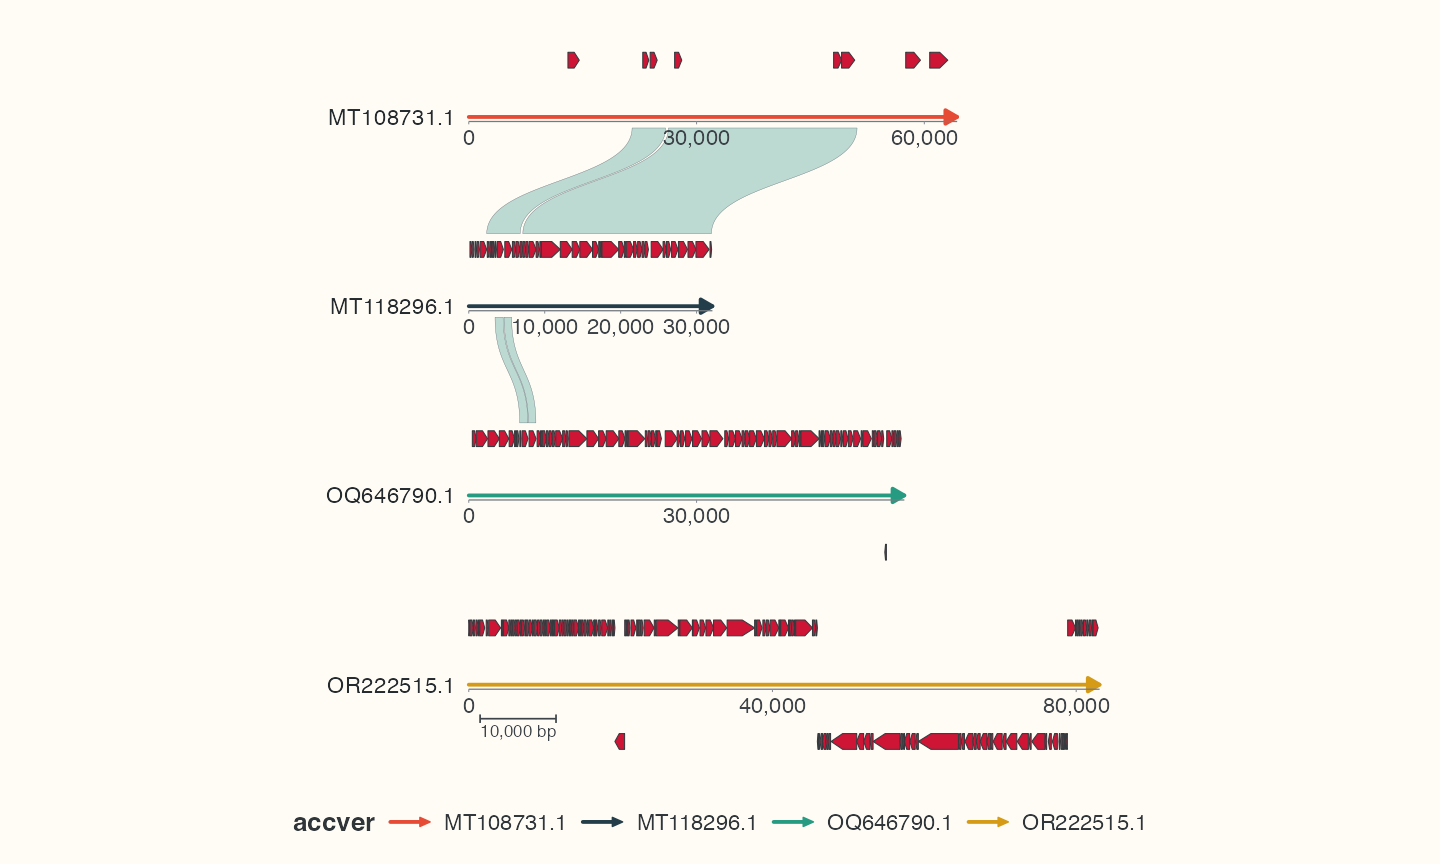
This view draws all imported annotations. Ribbons connect adjacent displayed sequences by default; retaining every comparison is an explicit layer decision. The bp scale bar belongs to collinear coordinates. See local views for cropping, source-coordinate axes and independent windows, and output to preview and save at the gallery’s stated dimensions.
5. Keep the evidence with the figure
The input archive contains unmodified FASTA/GFF3/BLAST files, a SHA256 manifest and the shared example script. The plot manifest records the code hash, PNG device, width, height and dpi. The accession names identify source records; a drawing is not a replacement for the original annotations or alignment evidence.
Select fields before passing data
The *_source objects keep original fields and provenance; seq_real has two columns, feature_real only geometry/type/text, and link_real adds identity and reported length only because this workflow filters and colours by them. Standard 12-column BLAST conversions are used, not a requirement for the historical 17 fields. The bundled gene fixture preserves its original strand in source_strand; the short examples restore that biological strand before selecting four gene columns. See alignment input for exact format and unit boundaries.
Check your result
Check that IDs agree across the tables, inspect filtering reports and verify that guides encode identity and strand. Use the overview to locate regions, then focus a neighbourhood to study a CDS.
Save this result
Save the plot just created to the working directory; use matching dimensions for preview.
Code
ggsave("phage-comparison.png", p_real_chord, width = 10, height = 8, units = "in", dpi = 144)