Site guide · find your task
Install and prepare the environment
On this page
Install and inspect the environment
R ≥4.1.0 and ggplot2 ≥4.0.0 are required. Installation and examples target v0.16.6.
Code
install.packages(c("remotes", "dplyr", "purrr", "tidyr"))
remotes::install_github("DangJem/ggchord@v0.16.6")
library(ggchord)
packageVersion("ggchord")
Which version are you using?
This tutorial documents ggchord 0.16.6. The installation above pins its formal tag; see GitHub Releases for release assets. For a source checkout, run from its repository root:
Code
install.packages("pkgload")
pkgload::load_all(".")
packageVersion("ggchord")
Use the loading route appropriate to your source; you do not need both installation paths. Record the version when reproducing a plot. This lesson needs neither optional Bioconductor packages nor Biopython.
Support evidence
Declared lower bounds are R 4.1.0 and ggplot2 4.0.0. Release checks and actual platform versions are recorded in the release acceptance report; these do not certify every dependency combination. Optional readers require their documented dependencies.
Choose a learning path
- Module I · Chord: learn the three tables, then import, backbones, layers and geometry.
- Module II · Collinear: reuse the chord inputs, then switch coordinates, route links and focus locally.
- Module III · Plasmid: start with one sequence and DNA, then add layers and explore 13 reference cases.
Starting with chord follows ggchord’s development order. See the learning map. The two-sequence exercise below is an optional environment check rather than a substitute for the modules.
Which columns come first?
Sequences need accver/length; links need two IDs and four endpoints; genes need accver/start/end/strand. Module I’s first lesson explains real tables, optional fields and BLAST naming.
Optional: check one complete plot
Run the whole folded block, then inspect the figure. Bundled source-backed records need no external files or BLAST run.
Preparation code — run once on this page
Code
library(ggchord)
library(dplyr)
data(seq_data_example)
data(gene_data_example)
data(ribbon_data_example)
ids <- c("MT108731.1", "MT118296.1")
first_sequences <- seq_data_example |>
  filter(accver %in% ids) |>
  select(accver, length)
first_genes <- gene_data_example |>
  filter(accver %in% ids) |>
  transmute(accver, start, end, strand = source_strand)
first_links <- ribbon_data_example |>
  filter(qaccver %in% ids, saccver %in% ids) |>
  select(qaccver, saccver, qstart, qend, sstart, send)

first_colours <- setNames(c("#E64B35", "#233E4A"), ids)
p_first <- ggchord(
  seq_data = first_sequences, ribbon_data = first_links,
  gene_data = first_genes
) +
  geom_link_ribbon(fill = "#82B6AD", alpha = .55) +
  geom_seq(colour = "#233E4A", show.legend = FALSE) +
  geom_gene(aes(gene_fill = accver), position = position_strand(.10), width = .045) +
  geom_seq_label(size = 4) +
  coord_collinear() +
  scale_gene_fill_manual(
    values = first_colours, name = "Sequence",
    guide = guide_ggchord_legend(nrow = 1, theme = theme(
      legend.title = element_text(size = 13, face = "bold"), legend.text = element_text(size = 11),
      legend.key.width = unit(9, "mm"), legend.key.height = unit(5, "mm"), legend.margin = margin(l = 7, unit = "mm")
    ))
  ) +
  scale_seq_position_continuous(n.breaks = 3, minor_breaks = NULL) +
  theme_ggchord_publication(axis.text = element_text(size = 11)) +
  theme(
    legend.position = "bottom",
    plot.background = element_rect(fill = "#FFFCF5", colour = NA),
    panel.background = element_blank()
  )
p_first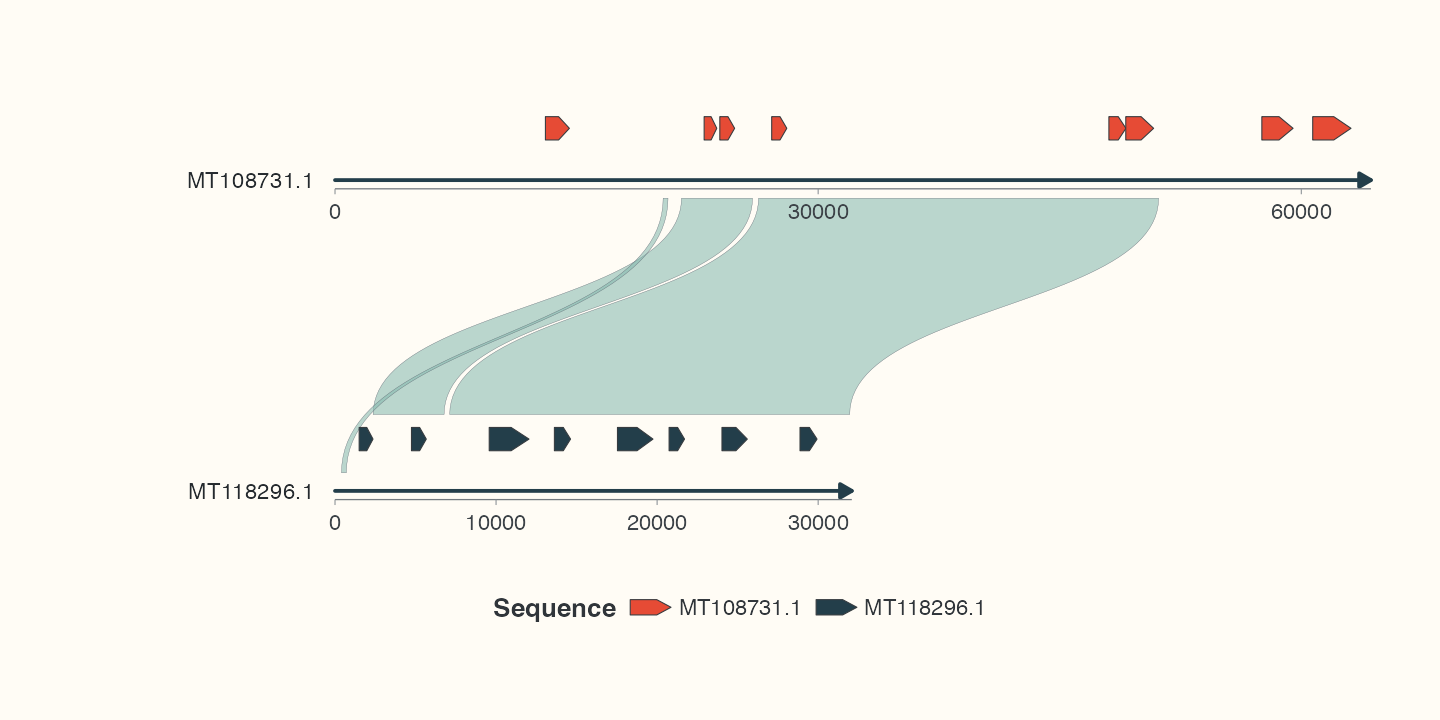
Read the quick result
Arrows retain biological strands; colours identify sequences only. Ribbons are existing comparison intervals, not new homology results. This small linear example makes positions easy to read; the full chord module starts with backbones.
Optional: save the quick result
Run this only after the block above has created p_first:
Code
ggsave("first-comparison.png", p_first, width = 10, height = 5, units = "in", dpi = 144)Use the same 10×5 in dimensions for preview and export; see output.
Common execution problems
For missing objects, run the preparation block. For missing functions, check the package version. getwd() determines the save directory. Optional readers need dependencies only in their own topics; basic modules do not require Bioconductor or Biopython.