Site guide · find your task
3.2 From a circle to annotation layers
On this page
Focus on the visual information added at each step. Preparation computes inputs; independent layers still control drawing.
Prepare this page
Preparation code — run once on this page
Code
library(ggchord)
feature_palette <- c(
  CDS = "#993366", promoter = "#31849B", rep_origin = "#F1E51D",
  primer_bind = "#A020F0", misc_feature = "#A6ACB3", protein_bind = "#31849B"
)

library(ggchord)
doc_background <- "#FFFCF5"
identity_palette <- c("#303B71", "#36537D", "#269B82", "#A5D52C", "#ECEB31")
identity_values <- c(0, 0.5, 0.8, 0.9, 1)
identity_breaks <- c(0, 50, 80, 90, 100)
doc_legend_theme <- theme(
  legend.title = element_text(size = 13, face = "bold"),
  legend.text = element_text(size = 11),
  legend.key.width = unit(9, "mm"), legend.key.height = unit(5, "mm"),
  legend.spacing.x = unit(9, "mm"), legend.spacing.y = unit(7, "mm"),
  legend.margin = margin(l = 4, r = 4, unit = "mm")
)
sequence_guide <- guide_ggchord_legend(nrow = 1, theme = doc_legend_theme)
strand_guide <- guide_ggchord_legend(
  nrow = 1, override.aes = list(strand = c("+", "-")), theme = doc_legend_theme
)
identity_guide <- guide_ggchord_colourbar(
  position = "left", direction = "vertical",
  theme = theme(
    legend.key.height = unit(75, "mm"), legend.key.width = unit(5, "mm"),
    legend.title = element_text(size = 13, face = "bold"),
    legend.text = element_text(size = 11), legend.margin = margin(r = 7, unit = "mm")
  )
)
doc_theme <- theme_ggchord_publication(
  axis.text = element_text(size = 11),
  axis.text.check.overlap = TRUE
) +
  theme(
    legend.position = "bottom",
    legend.title = element_text(size = 13, face = "bold"),
    legend.text = element_text(size = 11),
    legend.key.width = unit(9, "mm"), legend.key.height = unit(5, "mm"),
    legend.spacing.x = unit(9, "mm"), legend.spacing.y = unit(7, "mm"),
    legend.box.spacing = unit(6, "mm"),
    plot.background = element_rect(fill = doc_background, colour = NA),
    panel.background = element_blank(),
    plot.title = element_text(face = "bold", size = 18),
    plot.subtitle = element_text(size = 10, colour = "#5C625A"),
    plot.margin = margin(14, 18, 14, 18)
  )
doc_axis <- function(coordinates = "relative") {
  scale_seq_position_continuous(
    coordinates = coordinates, n.breaks = 3, minor_breaks = NULL,
    labels = function(x) format(x, scientific = FALSE, big.mark = ",", trim = TRUE)
  )
}

library(dplyr)
data(plasmid_example_pUC19)
plasmid_seq <- plasmid_example_pUC19 |>
  select(accver, length)
plasmid_feature_source <- find_common_features(plasmid_example_pUC19)
# Dedicated primer layers already show bindings; avoid duplicate primer annotations.
plasmid_features <- plasmid_feature_source |>
  filter(type != "primer_bind") |>
  select(accver, start, end, strand, type, anno)
plasmid_primers <- find_primer_bindings(plasmid_example_pUC19, set = "universal")
plasmid_sites <- find_restriction_sites(plasmid_example_pUC19)
display_sites <- filter_restriction_sites(plasmid_sites, enzymes = c("EcoRI", "BamHI", "HindIII"))
primer_names <- primer_catalog(set = "universal")
Code
plasmid_position <- position_feature_stack(spacing = 0.085, base_position = position_plasmid())
p_plasmid_backbone <- ggchord(seq_data = plasmid_seq) +
  geom_seq(seq_style = "double", colour = "#252525") +
  geom_seq_center_label() +
  coord_circular(rotation = 90) +
  theme_ggchord_plasmid() +
  theme(
    panel.background = element_blank(),
    plot.background = element_rect(fill = doc_background, colour = NA)
  )
p_plasmid_features <- p_plasmid_backbone +
  geom_feature_plasmid(data = plasmid_features, position = plasmid_position)
p_plasmid_text <- p_plasmid_features +
  geom_feature_label_repel(
    data = plasmid_features, position = plasmid_position,
    external = TRUE, label_fit = "shrink", label_min_size = 2.5
  )
p_plasmid_text
Step 1: double backbone and centre name
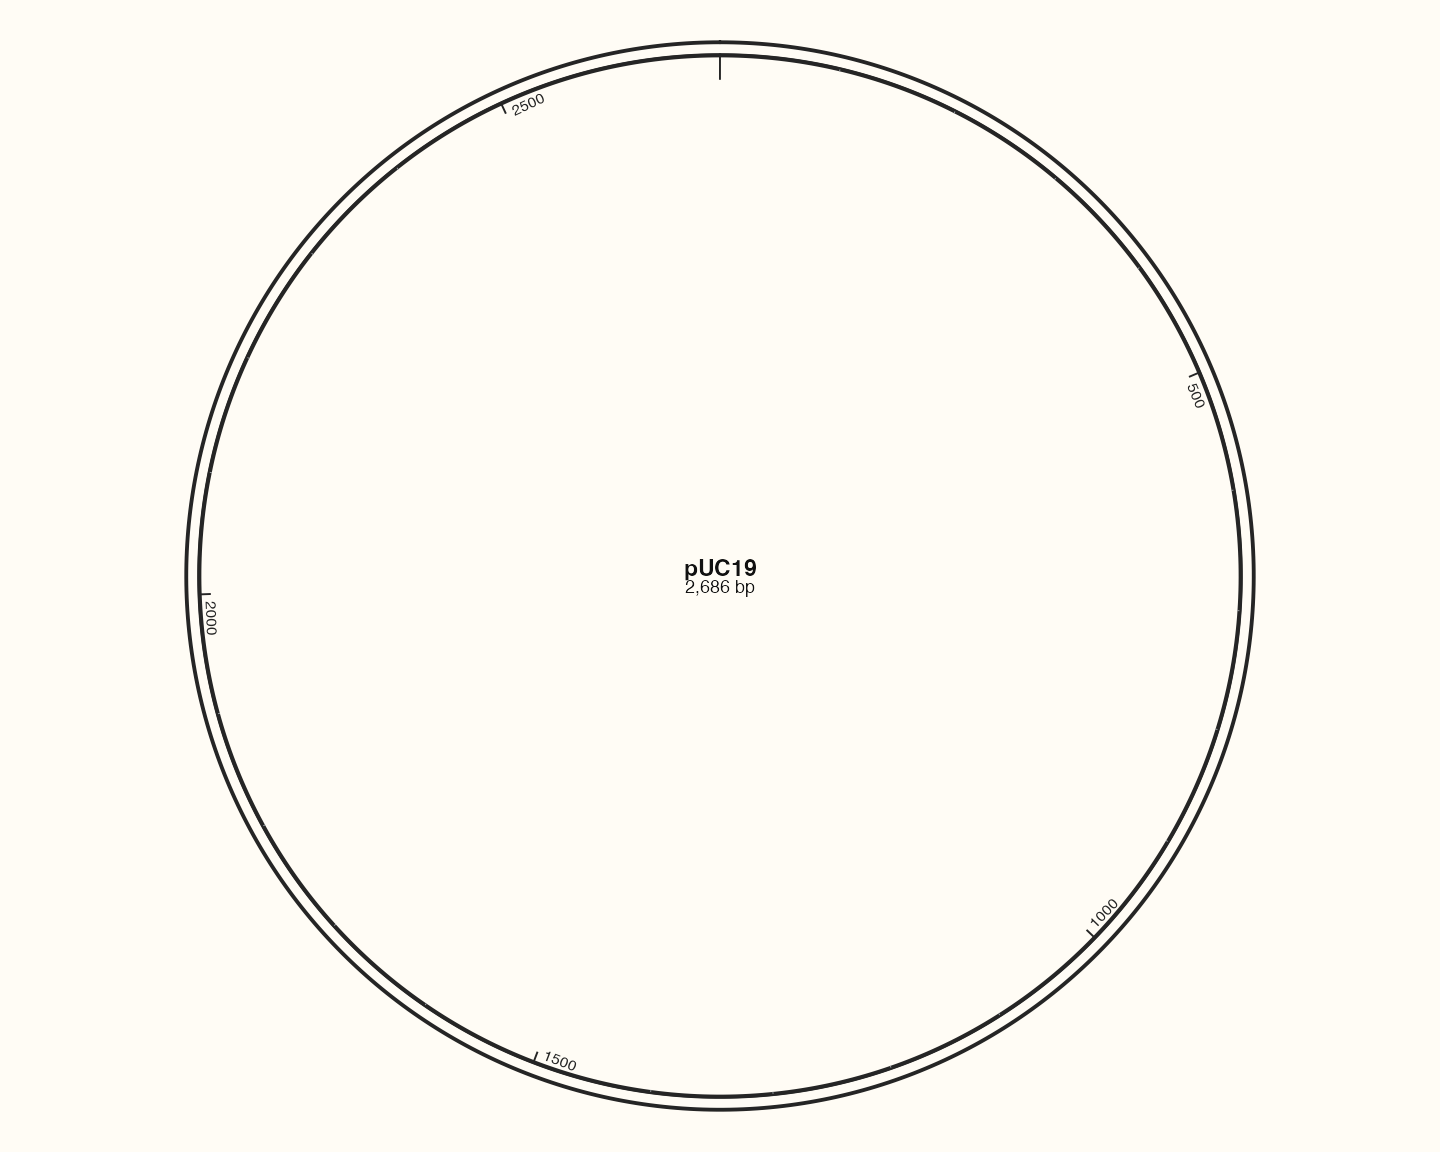
Check name and full length first. coord_circular() accepts one sequence; the geom owns the double-line style.
Step 2: feature shapes
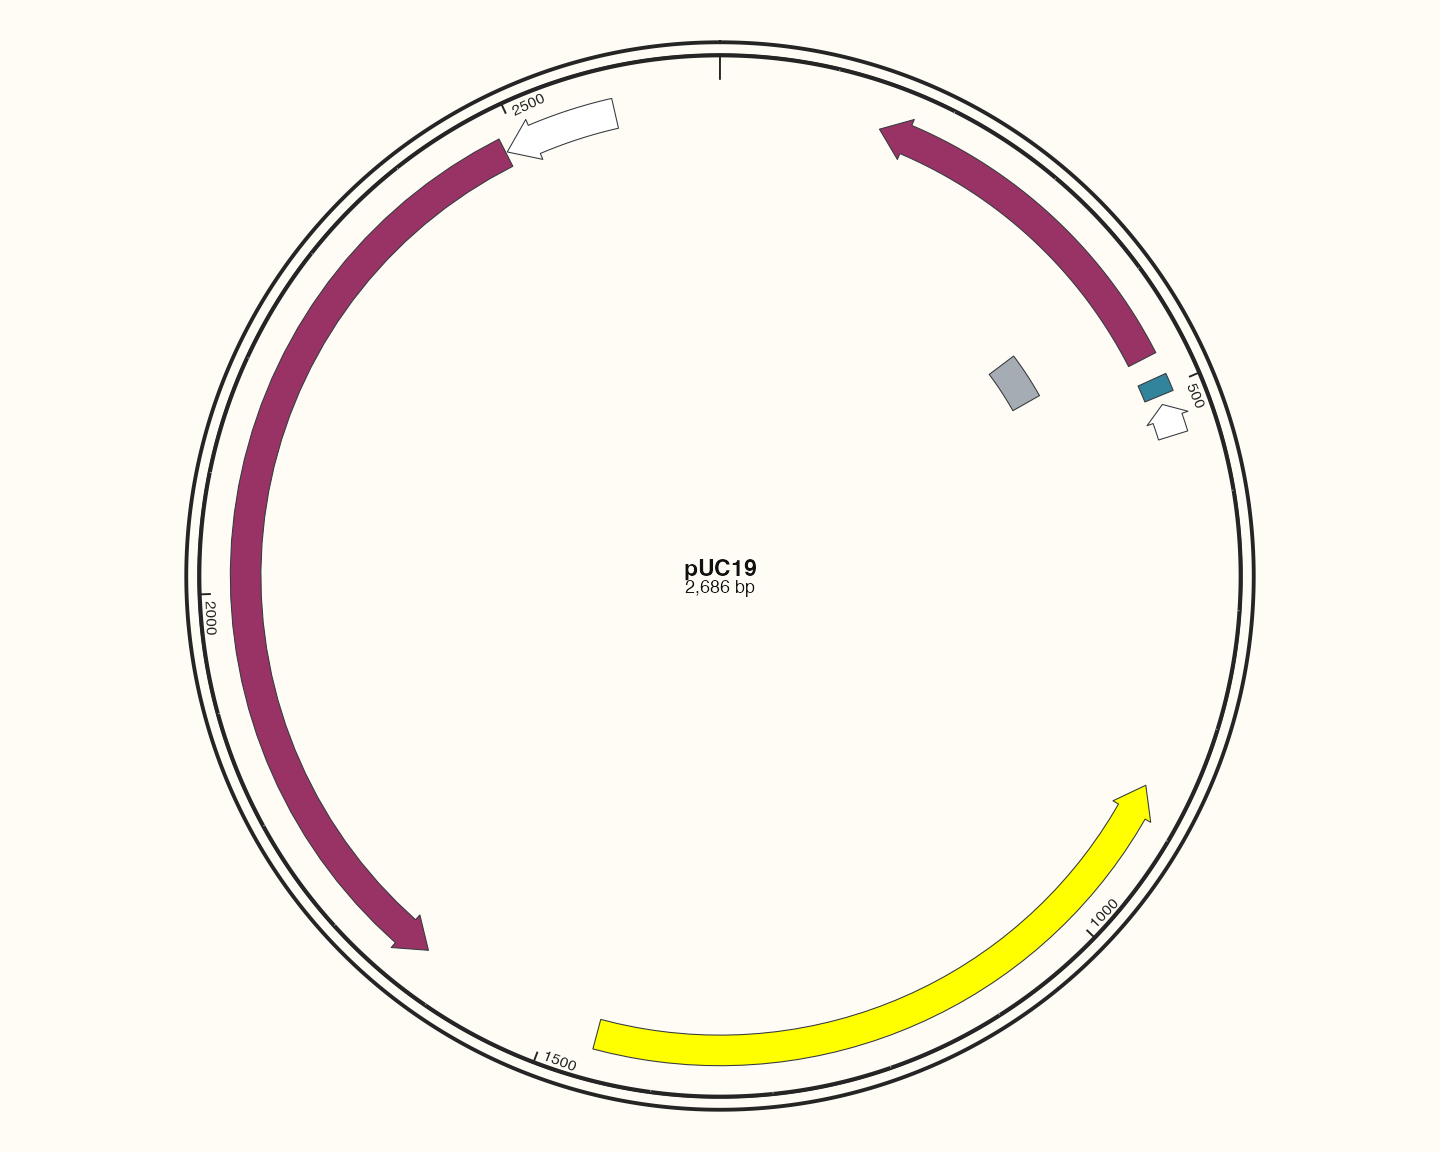
position_feature_stack() separates overlaps; geom_feature_plasmid() selects shapes and colours by real category. Compact short-feature shapes do not imply missing data.
Step 3: fitted feature labels
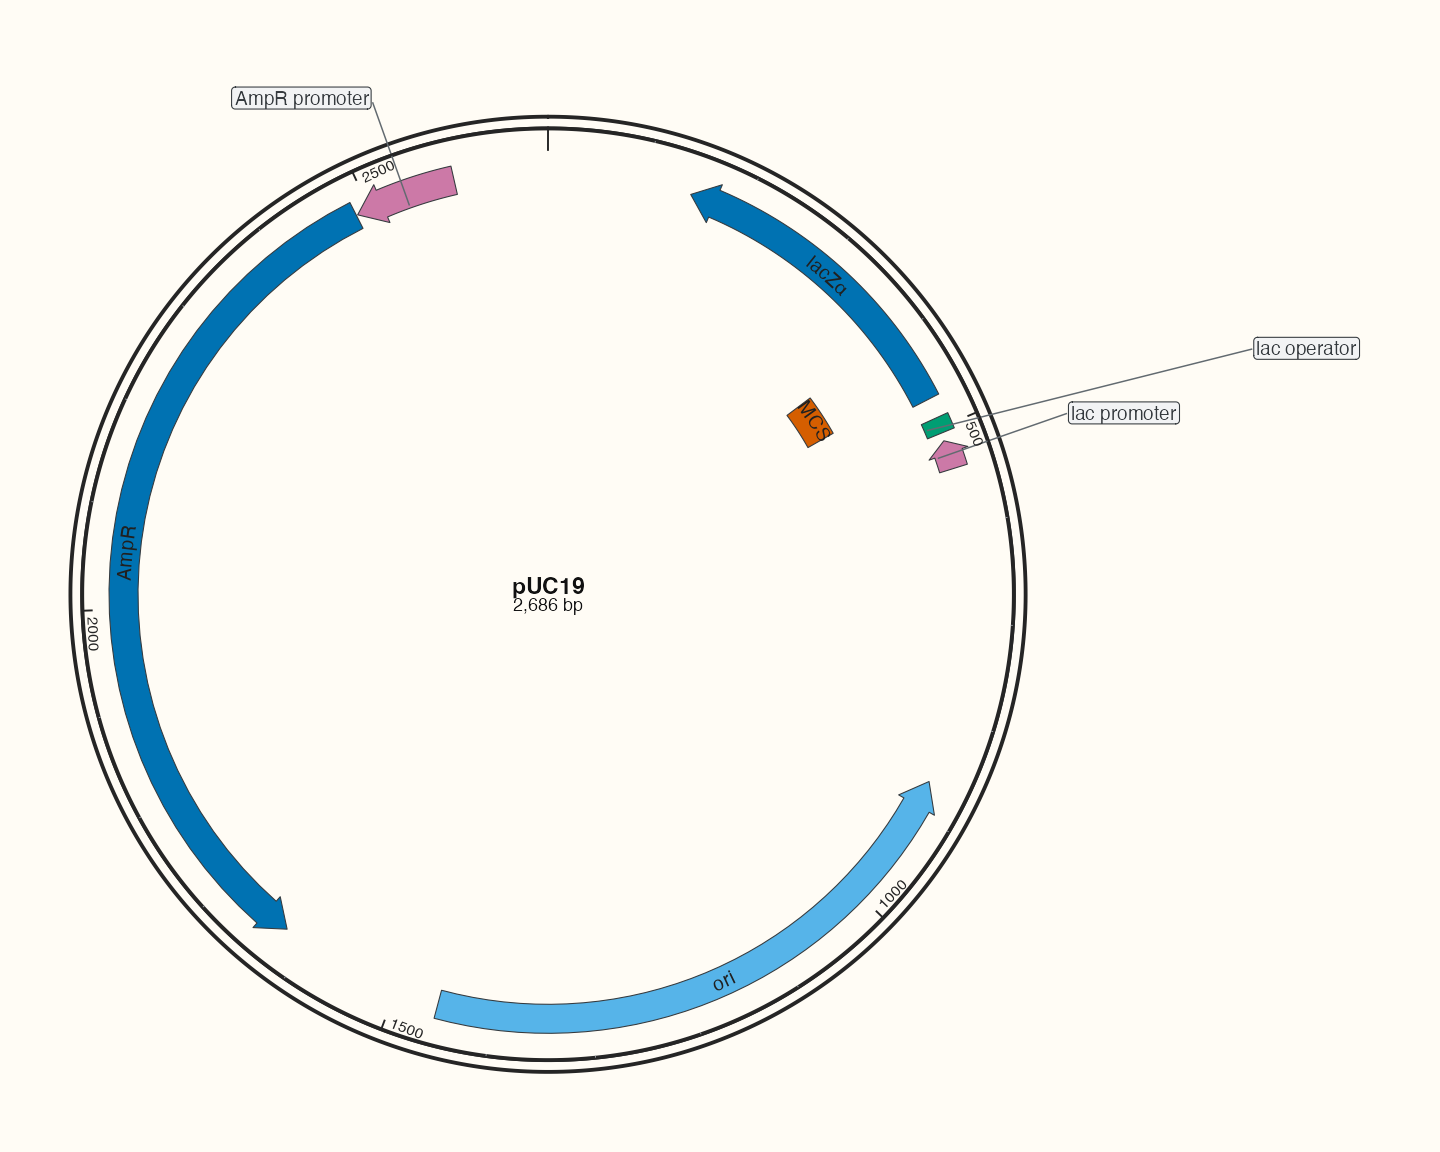
Geometry and labels share a Position. Allow shrinking only above an explicit minimum and external placement when necessary; recheck after changing dimensions.
Step 4: primers and selected restriction sites
Code
plasmid_position <- position_feature_stack(spacing = .10, base_position = position_plasmid())
p_plasmid <- ggchord(seq_data = plasmid_seq) +
  geom_seq(seq_style = "double") +
  geom_feature_plasmid(aes(feature_fill = type), data = plasmid_features, position = plasmid_position) +
  geom_feature_label_repel(
    data = plasmid_features, position = plasmid_position,
    size = 4
  ) +
  geom_primer(data = plasmid_primers, colour = "#A020F0") +
  geom_primer_label_repel(data = plasmid_primers, colour = "#A020F0", max_overlaps = 0, size = 3) +
  geom_restriction_site(data = display_sites, colour = "#29364B", label_size = 3, leader = "radial") +
  geom_seq_center_label() +
  scale_feature_fill_manual(values = feature_palette) +
  scale_seq_position_continuous() +
  coord_circular(rotation = 90) +
  theme_ggchord_plasmid() +
  theme(
    legend.title = element_text(size = 13, face = "bold"),
    legend.text = element_text(size = 11),
    legend.spacing.x = unit(9, "mm"), legend.spacing.y = unit(7, "mm"),
    plot.background = element_rect(fill = doc_background, colour = NA),
    panel.background = element_blank()
  )
p_plasmid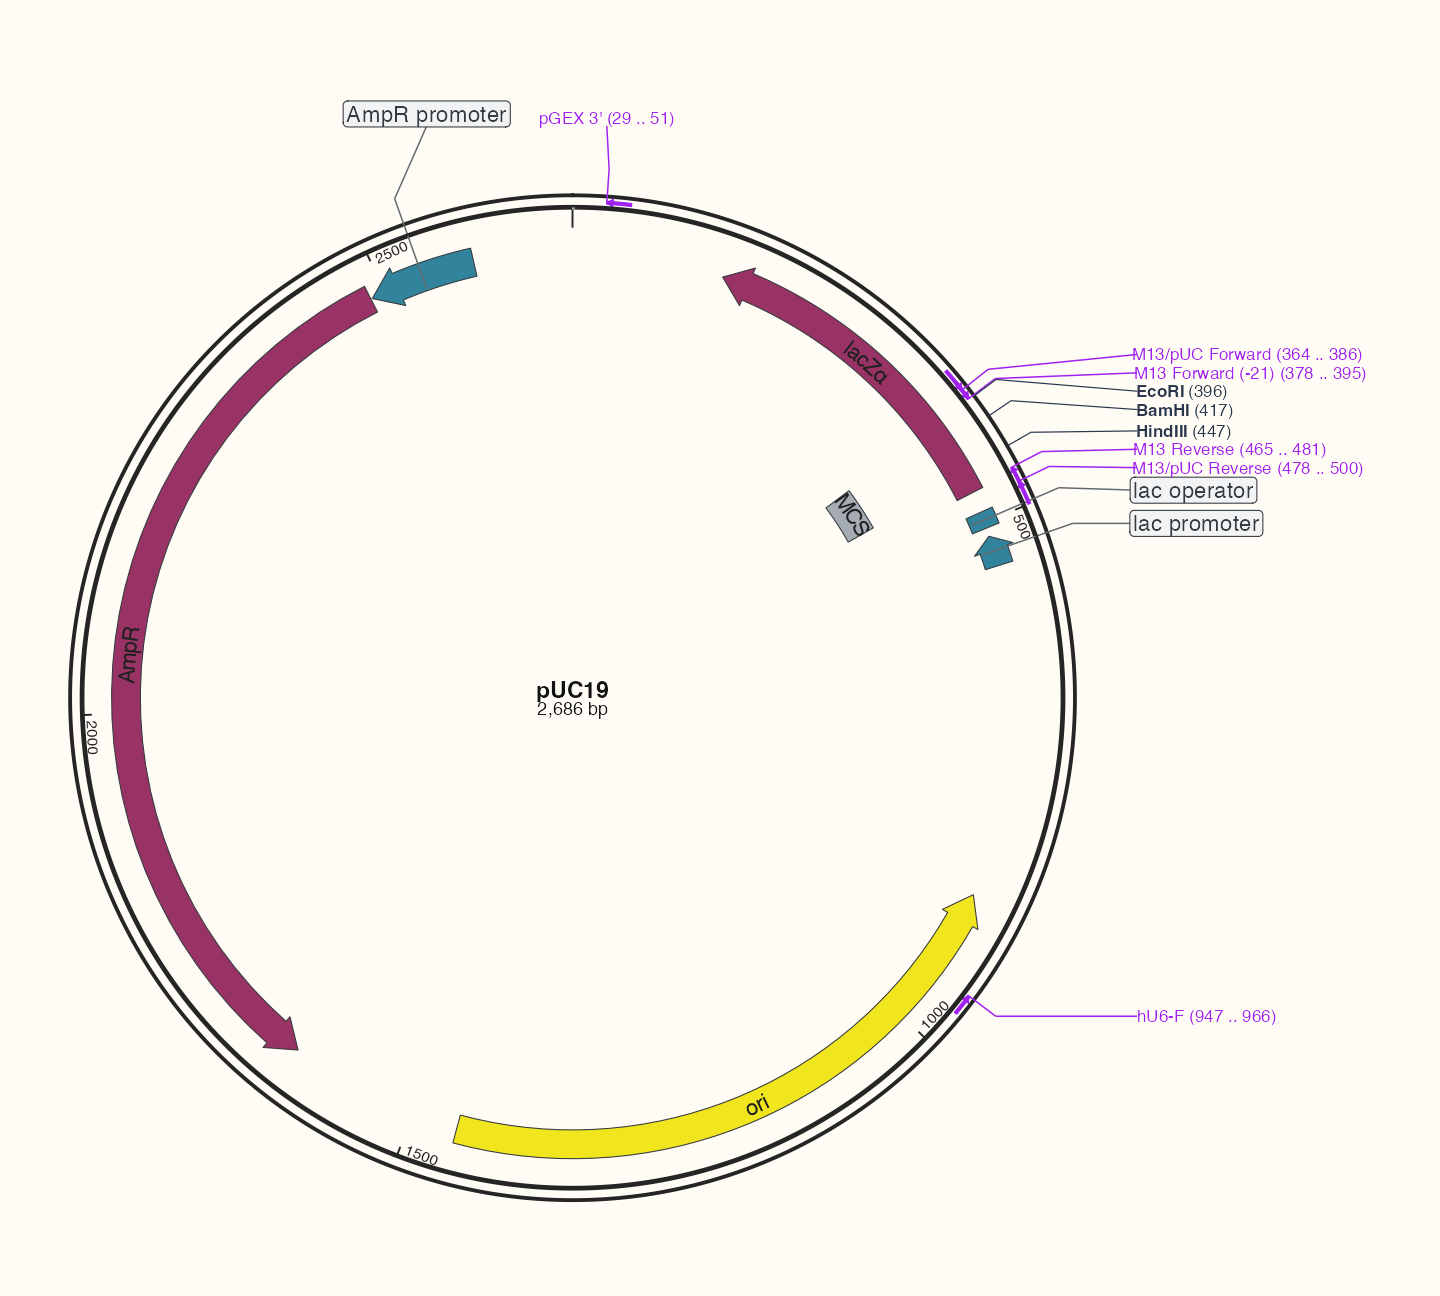
Only three selected enzyme sites are displayed; the full search table remains available. See 3.3 for recognition provenance and assumptions. Compare annotation densities across 13 references, then finish the dense pETDuet-1 showcase.