Site guide · find your task
2.4 Compare CDS neighbourhoods
On this page
Compare AmpR neighbourhoods in two plasmids. Check real coding DNA, establish correspondence, then focus to each CDS plus 200 bp on either side.
Prepare this page
Only bundled data is needed; no download or new alignment. Load the package and optional display settings first.
Preparation code — run once on this page
Code
library(ggchord)
doc_background <- "#FFFCF5"
identity_palette <- c("#303B71", "#36537D", "#269B82", "#A5D52C", "#ECEB31")
identity_values <- c(0, 0.5, 0.8, 0.9, 1)
identity_breaks <- c(0, 50, 80, 90, 100)
doc_legend_theme <- theme(
  legend.title = element_text(size = 13, face = "bold"),
  legend.text = element_text(size = 11),
  legend.key.width = unit(9, "mm"), legend.key.height = unit(5, "mm"),
  legend.spacing.x = unit(9, "mm"), legend.spacing.y = unit(7, "mm"),
  legend.margin = margin(l = 4, r = 4, unit = "mm")
)
sequence_guide <- guide_ggchord_legend(nrow = 1, theme = doc_legend_theme)
strand_guide <- guide_ggchord_legend(
  nrow = 1, override.aes = list(strand = c("+", "-")), theme = doc_legend_theme
)
identity_guide <- guide_ggchord_colourbar(
  position = "left", direction = "vertical",
  theme = theme(
    legend.key.height = unit(75, "mm"), legend.key.width = unit(5, "mm"),
    legend.title = element_text(size = 13, face = "bold"),
    legend.text = element_text(size = 11), legend.margin = margin(r = 7, unit = "mm")
  )
)
doc_theme <- theme_ggchord_publication(
  axis.text = element_text(size = 11),
  axis.text.check.overlap = TRUE
) +
  theme(
    legend.position = "bottom",
    legend.title = element_text(size = 13, face = "bold"),
    legend.text = element_text(size = 11),
    legend.key.width = unit(9, "mm"), legend.key.height = unit(5, "mm"),
    legend.spacing.x = unit(9, "mm"), legend.spacing.y = unit(7, "mm"),
    legend.box.spacing = unit(6, "mm"),
    plot.background = element_rect(fill = doc_background, colour = NA),
    panel.background = element_blank(),
    plot.title = element_text(face = "bold", size = 18),
    plot.subtitle = element_text(size = 10, colour = "#5C625A"),
    plot.margin = margin(14, 18, 14, 18)
  )
doc_axis <- function(coordinates = "relative") {
  scale_seq_position_continuous(
    coordinates = coordinates, n.breaks = 3, minor_breaks = NULL,
    labels = function(x) format(x, scientific = FALSE, big.mark = ",", trim = TRUE)
  )
}
1. Extract actual CDS and coding DNA
Select AmpR annotations from bundled pUC19 and pETDuet-1, retaining IDs, coordinates, strand and text. Reverse-complement negative-strand DNA so comparisons use the same biological orientation rather than annotation names alone.
Code
library(dplyr)
data(plasmid_example_pUC19)
data(plasmid_example_pETDuet_1)
homolog_source <- bind_rows(plasmid_example_pUC19, plasmid_example_pETDuet_1)
homolog_seq <- homolog_source |>
  select(accver, length)
cluster_features <- homolog_source |>
  find_common_features() |>
  filter(type == "CDS", anno == "AmpR") |>
  select(accver, start, end, strand, anno) |>
  arrange(match(accver, homolog_source$accver)) |>
  mutate(feature_id = paste(accver, start, end, sep = ":"))
# Membership is computed from exact strand-corrected CDS DNA equality, not gene names.
reverse_complement <- function(sequence) {
  bases <- strsplit(sequence, "")[[1]]
  chartr("ACGT", "TGCA", paste(rev(bases), collapse = ""))
}
coding_sequences <- cluster_features |>
  left_join(select(homolog_source, accver, sequence), by = "accver") |>
  rowwise() |>
  mutate(
    coding_dna = substr(sequence, start, end),
    coding_dna = if (strand == "-") reverse_complement(coding_dna) else coding_dna
  ) |>
  ungroup()
cds_dna <- pull(coding_sequences, coding_dna)
cluster_features should contain two actual CDS; cds_dna retains their oriented coding sequences. This strict example checks exact DNA equality. General homology analysis can use external alignments and clustering; homologs need not be identical.
2. Declare members and sequence pairs
Build membership from exact coding-DNA equality. Different DNA does not enter one group merely because both annotations say AmpR.
Code
membership <- tibble(
  feature_id = cluster_features$feature_id,
  cluster_id = paste0("exact_CDS_", match(cds_dna, unique(cds_dna)))
)
homologs <- link_ggchord_clusters(cluster_features, membership,
  pairs = tibble(qaccver = homolog_seq$accver[1], saccver = homolog_seq$accver[2])
)
loci <- find_ggchord_loci(homolog_seq, cluster_features,
  targets = cluster_features$feature_id[cluster_features$anno == "AmpR"][1], upstream = 100, downstream = 100
)
Inspect membership and homologs$report$comparisons and $members. The linking utility consumes existing groups; it does not compute a new alignment. Unknown members and ambiguous paralogs are reported; only explicit paralogs = "all" requests all combinations within the documented bounds.
3. Focus on comparable neighbourhoods
Full plasmid lengths would shrink the individual CDS. Construct windows from each real CDS source interval and add 200 bp on either side, retaining the original sequence and annotation tables.
Code
# Compare equivalent local windows instead of shrinking one gene on full plasmids.
homolog_windows <- cluster_features |>
  select(accver, start, end)
local_homologs <- focus_ggchord_data(homolog_seq, homologs$data, cluster_features,
  loci = homolog_windows, expand = 200
)
p_homologs <- ggchord(
  seq_data = local_homologs$seq_data,
  ribbon_data = local_homologs$ribbon_data, gene_data = local_homologs$gene_data
) +
  geom_link_ribbon(fill = "#269B82", alpha = .65) +
  geom_seq(colour = "#233E4A", show.legend = FALSE) +
  geom_feature(
    data = local_homologs$gene_data, feature_fill = "#F1D334",
    position = position_strand(.10), width = .07
  ) +
  geom_feature_label_repel(data = local_homologs$gene_data, size = 4, label_fit = "shrink") +
  geom_seq_label(size = 4) +
  geom_seq_break() +
  coord_collinear() +
  doc_axis("source") +
  doc_theme
p_homologs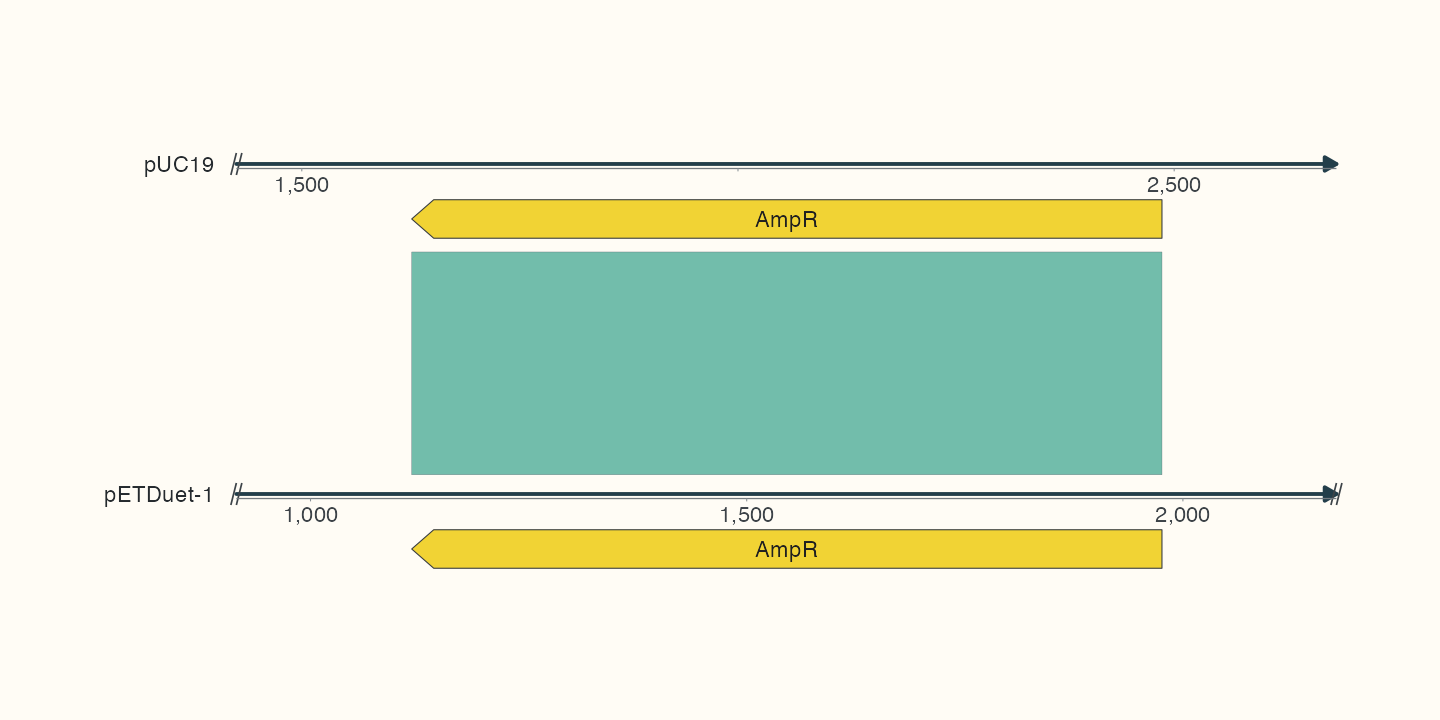
Gold arrows identify the checked identical coding sequences; the purple band connects their CDS ranges and internal text names AmpR. Axes use each original sequence’s positions, so one horizontal location can have different source labels. Break markers indicate that only local windows remain.
local_homologs$report records retention and clipping. Genes outside the windows are omitted, not absent. The band represents declared interval correspondence, not a base alignment; envelopes of segmented annotations likewise do not establish exon-level correspondence.
4. Project supported protein intervals to both CDS
Code
# Exact CDS DNA equality supplies evidence for these selected ungapped residues.
matching <- homologs$data |>
  slice_head(n = 1)
paired_coding <- cluster_features |>
  mutate(phase = 0)
paired_cds <- build_ggchord_cds(paired_coding)
protein_link <- tibble(
  qfeature_id = matching$qfeature_id, sfeature_id = matching$sfeature_id,
  qstart = 1, qend = 20, sstart = 1, send = 20
)
projected_links <- project_ggchord_links(protein_link, paired_cds, ungapped = TRUE)
projected_links| Metric | Observed output |
|---|---|
| Projected genomic feature rows | 1 |
| Projected nucleotide link rows | 1 |
The first 20 residues of identical CDS provide sequence evidence for ungapped = TRUE. Equal spans alone do not justify that claim for ordinary BLASTp HSPs. The utility retains protein statistics rather than presenting them as nucleotide identity.
Check your result
Both internal labels should read AmpR and arrows retain the actual negative strand. Coding DNA supports correspondence; source axes and focus reports explain the local display. Save at explicit 10 × 5 in dimensions.
Next: read real BLASTp query intervals, understand CDS projection and segments, or create independent local windows.
Save this result
Save the plot just created to the working directory; use matching dimensions for preview.
Code
ggsave("ampR-neighbourhood.png", p_homologs, width = 10, height = 5, units = "in", dpi = 144)