Site guide · find your task
2.6 Complete collinear showcase
On this page
Complete result
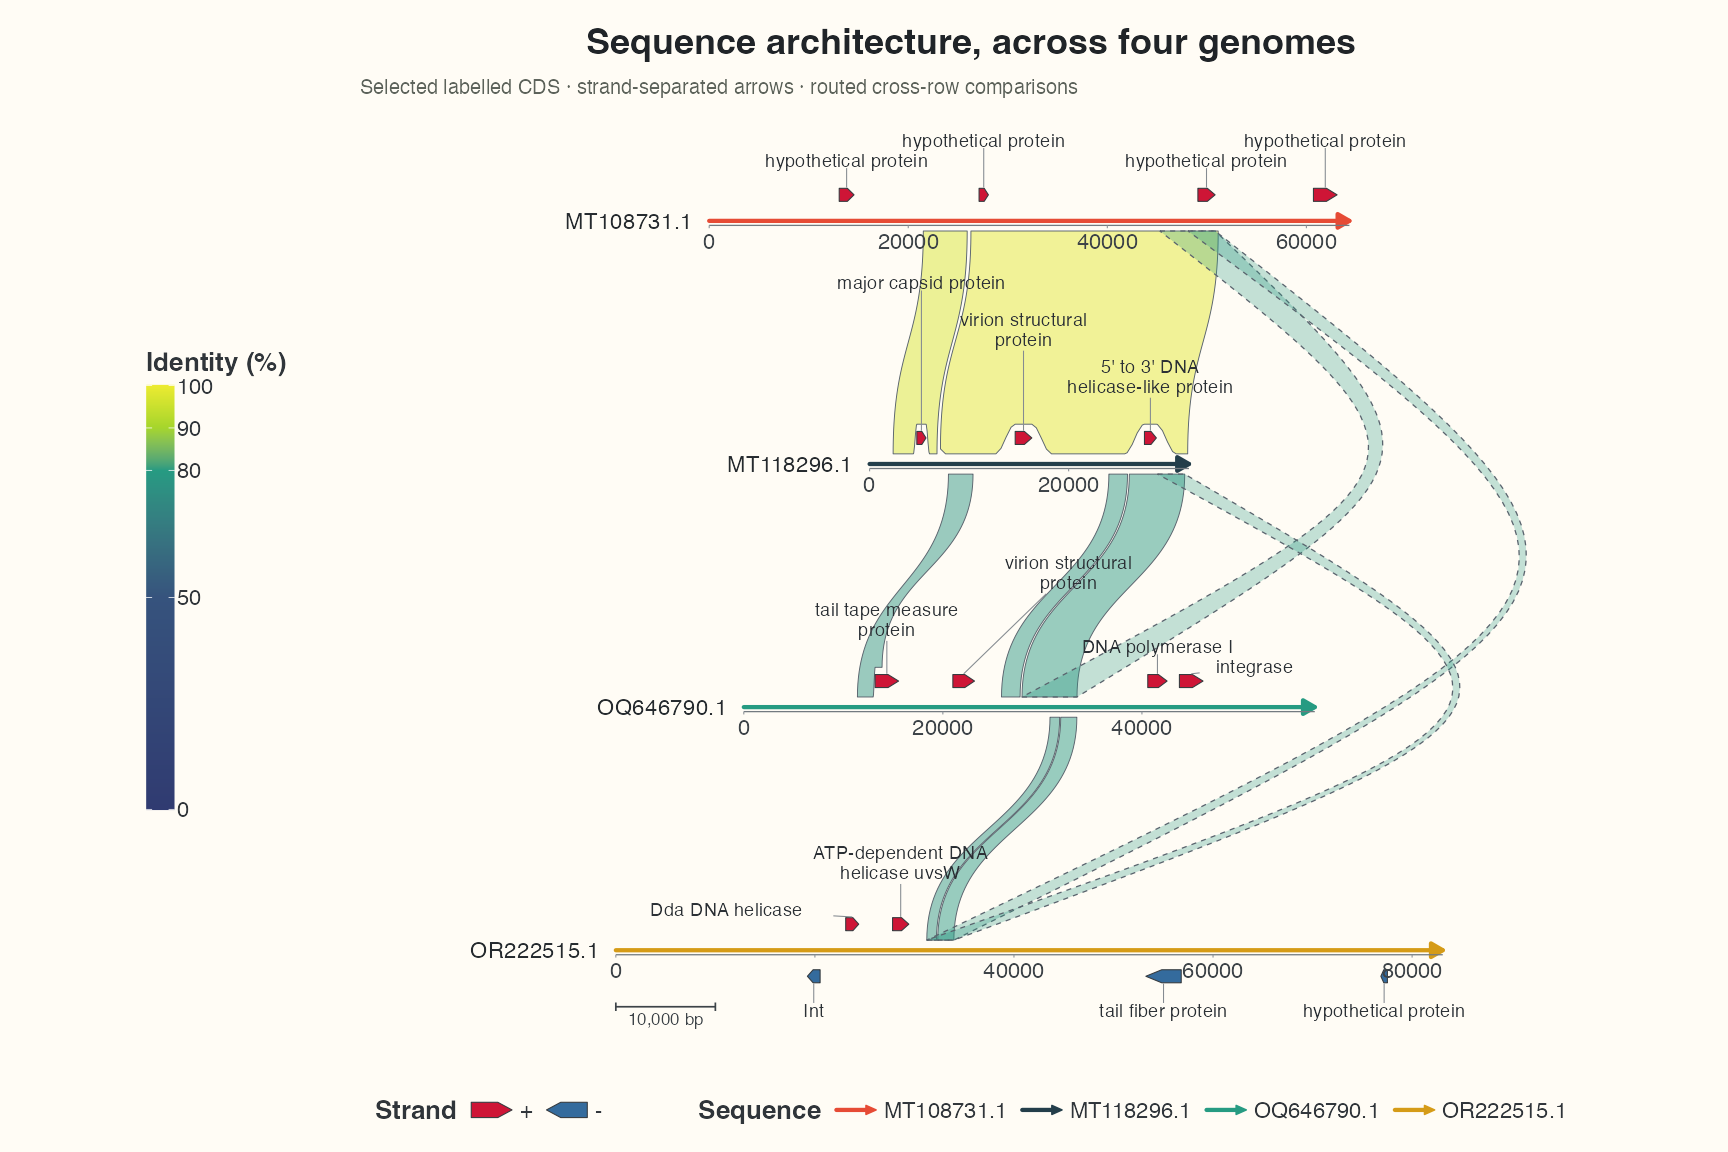
Collinearity extends the chord coordinate grammar; reusing data and layers is the goal. Read inputs, coordinate replacement and routes/ruler, then run the complete example. The identity scale and feature candidates are shared with the chord example; this linear composition omits two crowded short candidates, displaying 16 CDS with labels, with positive and negative strands above/below backbones.
Prepare original records
Extract the input bundle and install dplyr, purrr and tidyr first:
Preparation code — run once on this page
Code
# Optional appearance choices; none of these columns or scales is required input.
library(ggchord)
seq_palette <- setNames(
  c("#E64B35", "#233E4A", "#269B82", "#D59B17"),
  c("MT108731.1", "MT118296.1", "OQ646790.1", "OR222515.1")
)
gene_palette <- c("+" = "#CE1536", "-" = "#346B9D", "." = "#8291A6")

library(ggchord)
doc_background <- "#FFFCF5"
identity_palette <- c("#303B71", "#36537D", "#269B82", "#A5D52C", "#ECEB31")
identity_values <- c(0, 0.5, 0.8, 0.9, 1)
identity_breaks <- c(0, 50, 80, 90, 100)
doc_legend_theme <- theme(
  legend.title = element_text(size = 13, face = "bold"),
  legend.text = element_text(size = 11),
  legend.key.width = unit(9, "mm"), legend.key.height = unit(5, "mm"),
  legend.spacing.x = unit(9, "mm"), legend.spacing.y = unit(7, "mm"),
  legend.margin = margin(l = 4, r = 4, unit = "mm")
)
sequence_guide <- guide_ggchord_legend(nrow = 1, theme = doc_legend_theme)
strand_guide <- guide_ggchord_legend(
  nrow = 1, override.aes = list(strand = c("+", "-")), theme = doc_legend_theme
)
identity_guide <- guide_ggchord_colourbar(
  position = "left", direction = "vertical",
  theme = theme(
    legend.key.height = unit(75, "mm"), legend.key.width = unit(5, "mm"),
    legend.title = element_text(size = 13, face = "bold"),
    legend.text = element_text(size = 11), legend.margin = margin(r = 7, unit = "mm")
  )
)
doc_theme <- theme_ggchord_publication(
  axis.text = element_text(size = 11),
  axis.text.check.overlap = TRUE
) +
  theme(
    legend.position = "bottom",
    legend.title = element_text(size = 13, face = "bold"),
    legend.text = element_text(size = 11),
    legend.key.width = unit(9, "mm"), legend.key.height = unit(5, "mm"),
    legend.spacing.x = unit(9, "mm"), legend.spacing.y = unit(7, "mm"),
    legend.box.spacing = unit(6, "mm"),
    plot.background = element_rect(fill = doc_background, colour = NA),
    panel.background = element_blank(),
    plot.title = element_text(face = "bold", size = 18),
    plot.subtitle = element_text(size = 10, colour = "#5C625A"),
    plot.margin = margin(14, 18, 14, 18)
  )
doc_axis <- function(coordinates = "relative") {
  scale_seq_position_continuous(
    coordinates = coordinates, n.breaks = 3, minor_breaks = NULL,
    labels = function(x) format(x, scientific = FALSE, big.mark = ",", trim = TRUE)
  )
}
Code
library(ggchord)
library(dplyr)
library(purrr)
library(tidyr)
# Original repository records; extract the tutorial input bundle first.
show_sequences <- read_fasta_lengths(files = "examples/fasta/*.fna") |>
  select(accver, length)
show_annotations <- read_gff3(files = "examples/gff3/*.gff3", unstranded = "keep")
show_genes <- show_annotations |>
  filter(type == "CDS") |>
  select(accver, start, end, strand, anno)
show_alignments <- read_blast(files = "examples/blastn-standard/*.tsv")
# At most three substantial observed HSPs per pair; no coordinates are invented.
show_links <- show_alignments |>
  filter(length >= 900, pident >= 75) |>
  group_by(qaccver, saccver) |>
  slice_max(length, n = 3, with_ties = FALSE) |>
  ungroup()
# Select up to four source CDS per sequence, spread across annotation order.
# No feature is moved or invented; keep complete source tables separately.
show_features <- show_genes |>
  filter(end - start + 1 >= 500) |>
  group_by(accver) |>
  arrange(start, .by_group = TRUE) |>
  mutate(display_bin = ntile(row_number(), 4), informative = !is.na(anno) & anno != "hypothetical protein") |>
  group_by(accver, display_bin) |>
  arrange(desc(informative), desc(end - start), .by_group = TRUE) |>
  slice_head(n = 1) |>
  ungroup() |>
  select(accver, start, end, strand, anno)
# Also retain well-separated negative-strand CDS, if not already represented.
show_reverse <- show_genes |>
  filter(strand == "-", end - start + 1 >= 500) |>
  group_by(accver) |>
  arrange(start, .by_group = TRUE) |>
  slice(c(1, n())) |>
  ungroup()
show_features <- bind_rows(show_features, show_reverse) |>
  distinct(accver, start, end, strand, .keep_all = TRUE) |>
  arrange(accver, start)
show_labels <- show_features
show_optimization <- optimize_ggchord_layout(
  show_sequences, show_links,
  optimize = "orientation", weight = "length"
)
Retain four full FASTA records, 266 CDS and 32 original HSPs. Adjacent rows use the explicitly selected observations; each non-neighbour pair retains only its longest HSP to reduce overlap.
Reserve space for connections and labels
The flagship no longer includes GC tracks; composition analysis remains in tracks. This keeps two different reading tasks from competing in the entry figure.
Compose the layers
Code
# Omit two short, crowded candidates from this linear display only.
# Both source rows remain in show_features and in the chord display.
show_linear_features <- show_features |>
  filter(!anno %in% c("tail assembly protein", "gp4 protein"))
# Separate adjacent and cross-row links, retaining original endpoint values.
show_pair_rows <- show_links |>
  mutate(
    query_row = match(qaccver, show_sequences$accver),
    subject_row = match(saccver, show_sequences$accver),
    span = abs(query_row - subject_row)
  )
show_adjacent <- show_pair_rows |> filter(span == 1)
# One longest observed HSP per non-neighbour pair keeps the long routes legible.
show_cross <- show_pair_rows |>
  filter(span > 1) |>
  group_by(qaccver, saccver) |>
  slice_max(length, n = 1, with_ties = FALSE) |>
  ungroup()
# Inspect a backbone-only layout using the same alignment and gap as the final view.
show_linear_coord <- coord_collinear(align = "center", orientation = "auto", ratio = 0.7)
show_routing_base <- ggchord(show_sequences, show_links) +
  geom_seq(seq_gap = 0.42) + show_linear_coord
show_reference <- get_chord_layout(show_routing_base)$sequence_reference
# Shared controls sit just beyond the intervening backbones, rather than far away.
show_cross_controls <- map2(show_cross$query_row, show_cross$subject_row, function(query_row, subject_row) {
  between <- seq(min(query_row, subject_row) + 1L, max(query_row, subject_row) - 1L)
  middle_ids <- show_sequences$accver[between]
  right_edge <- max(show_reference$x_offset[middle_ids] + show_reference$lens[middle_ids] * show_reference$x_scale)
  middle_y <- mean(show_reference$y[show_sequences$accver[c(query_row, subject_row)]])
  c(right_edge + if (abs(query_row - subject_row) == 3) 0.85 else 0.65, middle_y)
})
p_show_collinear <- ggchord(show_sequences, gene_data = show_linear_features) +
  geom_link_ribbon(
    aes(ribbon_fill = pident),
    data = show_adjacent,
    link_avoid = "smooth", alpha = 0.48, linewidth = 0.22
  ) +
  geom_link_ribbon(
    aes(ribbon_fill = pident),
    data = show_cross,
    adjacent_only = FALSE, link_ctrl_point = show_cross_controls,
    link_avoid = "smooth", alpha = 0.28, linewidth = 0.3
  ) +
  geom_seq(seq_gap = 0.42, linewidth = 1) +
  geom_gene(position = position_strand(0.09), width = 0.045) +
  geom_gene_label_repel(
    data = show_linear_features |> arrange(desc(nchar(anno)), accver, start),
    label_layout = "auto", label_wrap = 24,
    label_side = "auto", position = position_strand(0.09), size = 3.3
  ) +
  geom_seq_label(size = 4) +
  geom_seq_scale(length = 10000, offset = unit(c(0, 10), "mm")) +
  scale_seq_colour_manual(
    values = seq_palette, name = "Sequence",
    guide = sequence_guide
  ) +
  scale_gene_fill_manual(values = gene_palette, breaks = c("+", "-"), name = "Strand") +
  scale_ribbon_fill_gradientn(
    colours = identity_palette, values = identity_values,
    limits = c(0, 100), breaks = identity_breaks, name = "Identity (%)", guide = identity_guide
  ) +
  guides(gene_fill = strand_guide) +
  scale_seq_position_continuous(breaks = c(0, 20000, 40000, 60000, 80000), minor_breaks = NULL) +
  show_linear_coord +
  doc_theme +
  labs(
    title = "Sequence architecture, across four genomes",
    subtitle = "Selected labelled CDS · strand-separated arrows · routed cross-row comparisons"
  )
p_show_collinear
Dashed outlines identify non-adjacent displayed rows, with sufficient linewidth to read. Right-side controls separate long routes; smooth local clearance retreats near arrows. Identity has the same left-side colourbar as the chord view, and the bottom strand keys use arrows. The ruler’s horizontal offset is 0; its length still uses the shared bp conversion.
Adjustment and limits
Rebuild controls when changing seq_gap, order, orientation or link selection. Local arrow clearance is not an automatic route around intervening whole sequences; ribbons may still cross legitimately. Use focus/segments for local questions. Explicit circular radius/curvature cannot currently be passed to linear coordinates; see conversion boundaries.
Save at the intended size
Code
ggsave("four-genome-collinear.png", p_show_collinear, width = 12, height = 8, units = "in", dpi = 144)