Site guide · find your task
1.5 Filter and summarize links
On this page
Reduce link clutter while retaining provenance: filtering, deduplication, merging and bundling have different meanings.
Prepare this page
In a fresh R session, run the code below, then follow this page in order. Colours and layout are optional display choices; inputs select only the fields needed. For file-based examples, first extract the input bundle so the working directory contains examples/.
Preparation code — run once on this page
Code
library(ggchord)
library(dplyr)
data(seq_data_example)
data(ribbon_data_example)
data(gene_data_example)
seqs <- seq_data_example |>
  select(accver, length)
links <- ribbon_data_example |>
  select(qaccver, saccver, qstart, qend, sstart, send)
# The fixture preserves biological strands separately from its old display strands.
genes <- gene_data_example |>
  transmute(accver, start, end, strand = source_strand)

# Optional appearance choices; none of these columns or scales is required input.
library(ggchord)
seq_palette <- setNames(
  c("#E64B35", "#233E4A", "#269B82", "#D59B17"),
  c("MT108731.1", "MT118296.1", "OQ646790.1", "OR222515.1")
)
gene_palette <- c("+" = "#CE1536", "-" = "#346B9D", "." = "#8291A6")

library(ggchord)
doc_background <- "#FFFCF5"
identity_palette <- c("#303B71", "#36537D", "#269B82", "#A5D52C", "#ECEB31")
identity_values <- c(0, 0.5, 0.8, 0.9, 1)
identity_breaks <- c(0, 50, 80, 90, 100)
doc_legend_theme <- theme(
  legend.title = element_text(size = 13, face = "bold"),
  legend.text = element_text(size = 11),
  legend.key.width = unit(9, "mm"), legend.key.height = unit(5, "mm"),
  legend.spacing.x = unit(9, "mm"), legend.spacing.y = unit(7, "mm"),
  legend.margin = margin(l = 4, r = 4, unit = "mm")
)
sequence_guide <- guide_ggchord_legend(nrow = 1, theme = doc_legend_theme)
strand_guide <- guide_ggchord_legend(
  nrow = 1, override.aes = list(strand = c("+", "-")), theme = doc_legend_theme
)
identity_guide <- guide_ggchord_colourbar(
  position = "left", direction = "vertical",
  theme = theme(
    legend.key.height = unit(75, "mm"), legend.key.width = unit(5, "mm"),
    legend.title = element_text(size = 13, face = "bold"),
    legend.text = element_text(size = 11), legend.margin = margin(r = 7, unit = "mm")
  )
)
doc_theme <- theme_ggchord_publication(
  axis.text = element_text(size = 11),
  axis.text.check.overlap = TRUE
) +
  theme(
    legend.position = "bottom",
    legend.title = element_text(size = 13, face = "bold"),
    legend.text = element_text(size = 11),
    legend.key.width = unit(9, "mm"), legend.key.height = unit(5, "mm"),
    legend.spacing.x = unit(9, "mm"), legend.spacing.y = unit(7, "mm"),
    legend.box.spacing = unit(6, "mm"),
    plot.background = element_rect(fill = doc_background, colour = NA),
    panel.background = element_blank(),
    plot.title = element_text(face = "bold", size = 18),
    plot.subtitle = element_text(size = 10, colour = "#5C625A"),
    plot.margin = margin(14, 18, 14, 18)
  )
doc_axis <- function(coordinates = "relative") {
  scale_seq_position_continuous(
    coordinates = coordinates, n.breaks = 3, minor_breaks = NULL,
    labels = function(x) format(x, scientific = FALSE, big.mark = ",", trim = TRUE)
  )
}

library(dplyr)
sequence_source <- read_fasta_lengths(files = "examples/fasta/*.fna", source_file = TRUE)
seq_real <- sequence_source |>
  select(accver, length)
annotation_source <- read_gff3(files = "examples/gff3/*.gff3", unstranded = "keep", source_file = TRUE)
feature_real <- annotation_source |>
  select(accver, start, end, strand, type, anno)
alignment_source <- read_blast(files = "examples/blastn-standard/*.tsv", source_file = TRUE)
link_real <- alignment_source |>
  select(qaccver, saccver, qstart, qend, sstart, send, pident, length)
real_validation <- validate_ggchord_data(seq_real, link_real)
real_validation

real_prepared <- prepare_ggchord_data(seq_real, link_real,
  features = list(annotation = feature_real)
)
real_filtered <- filter_ggchord_ribbons(link_real, min_pident = 80, min_length = 500)
# Explicit display subset: the six longest CDS per sequence; raw annotations stay intact.
real_display_features <- feature_real |>
  group_by(accver) |>
  slice_max(end - start + 1, n = 6, with_ties = FALSE) |>
  ungroup()
real_labels <- real_display_features |>
  filter(anno != "hypothetical protein") |>
  group_by(accver) |>
  slice_head(n = 2) |>
  ungroup()
real_filtered$report
Begin with the original link table
Use the real-record workflow to create seq_real, link_real and real_filtered. Keep its original tables and filter report.
Code
unique_links <- deduplicate_ggchord_ribbons(real_filtered$data,
  by = "overlap",
  min_reciprocal_overlap = .9
)
merged_links <- merge_ggchord_ribbons(unique_links$data,
  max_gap = 100,
  min_pident_difference = 2
)
bundled_links <- bundle_ggchord_ribbons(link_real, seq_real, bins = 30)
p_density <- ggchord(seq_real, link_real, validate = "none") +
  geom_seq(show.legend = FALSE) +
  geom_seq_label(size = 4, seq_label_radius = .84, seq_label_hjust = .5) +
  stat_ribbon_density(aes(ribbon_alpha = after_stat(density)), fill = "#269B82") +
  scale_ribbon_alpha_continuous(
    name = "Relative density", range = c(.1, .6),
    guide = guide_ggchord_legend(position = "bottom", nrow = 1, theme = doc_legend_theme)
  ) +
  scale_seq_colour_manual(values = seq_palette) +
  coord_chord() +
  doc_theme
p_bundle <- ggchord(seq_real, link_real, validate = "none") +
  geom_seq() +
  stat_ribbon_bundle(bins = 30, fill = "#269B82") +
  coord_chord() +
  doc_theme
p_density| Metric | Observed output |
|---|---|
| Filtered HSPs | 8 |
| After overlap deduplication | 8 |
| Merged display intervals | 8 |
| Bundle output rows | 28 |
Understand each transformation
Filtering keeps observations meeting declared thresholds. Reciprocal-overlap deduplication selects a representative existing observation; it does not sum identities. Merging combines nearby compatible intervals into a display envelope. Bundling groups nearby query/subject locations into an aggregate. Inspect each $report and source-row membership, especially when extra metadata conflict. The merged or bundled envelope is not a newly computed nucleotide alignment. Estimated lengths retain their flags; unobserved identity is never invented.
Density is an explicit statistic
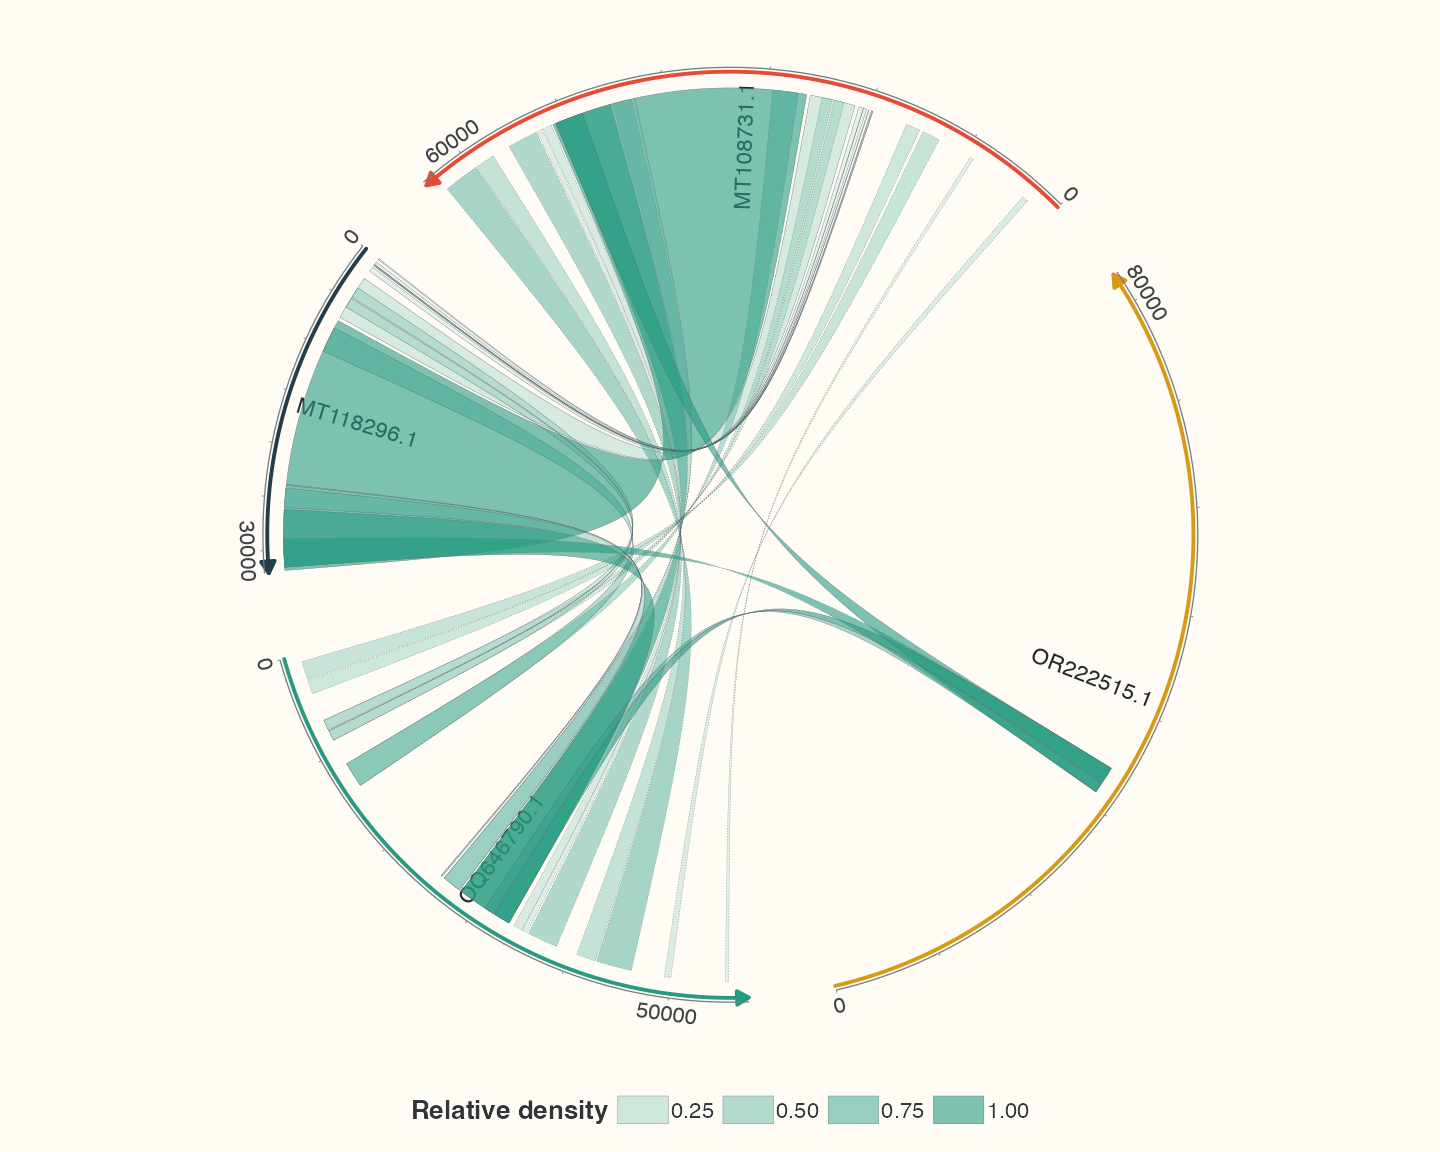
stat_ribbon_density() maps a computed density, and stat_ribbon_bundle() performs its explicit aggregation during build. The ordinary ribbon geom still draws one ribbon per row. Interpret count, reported length and identity weighting in their own units; more opaque ribbons need not mean stronger independently validated homology. A point anchor without direction evidence cannot acquire an aggregate orientation merely because its endpoints are equal.
Choose interval ribbons or point links
After this page’s preparation code:
Code
# Midpoints summarize existing HSPs for display; they are not new alignments.
points <- ribbon_data_example |>
  transmute(
    qaccver, saccver,
    qpos = floor((qstart + qend) / 2),
    spos = floor((sstart + send) / 2),
    pident
  )
p_points <- ggchord(seq_data = seqs) +
  geom_seq() +
  geom_seq_label(size = 4) +
  geom_link_line(aes(link_colour = pident),
    data = points,
    arrow = arrow(length = unit(2, "mm")), linewidth = .7
  ) +
  scale_link_colour_gradientn(
    colours = identity_palette, values = identity_values,
    limits = c(0, 100), breaks = identity_breaks,
    name = "Identity (%)", guide = guide_ggchord_colourbar(
      available_aes = "link_colour",
      position = "bottom", direction = "horizontal",
      theme = doc_legend_theme + theme(legend.key.width = unit(65, "mm"), legend.key.height = unit(5, "mm"))
    )
  ) +
  scale_seq_colour_manual(values = seq_palette) +
  coord_chord() +
  doc_theme
p_points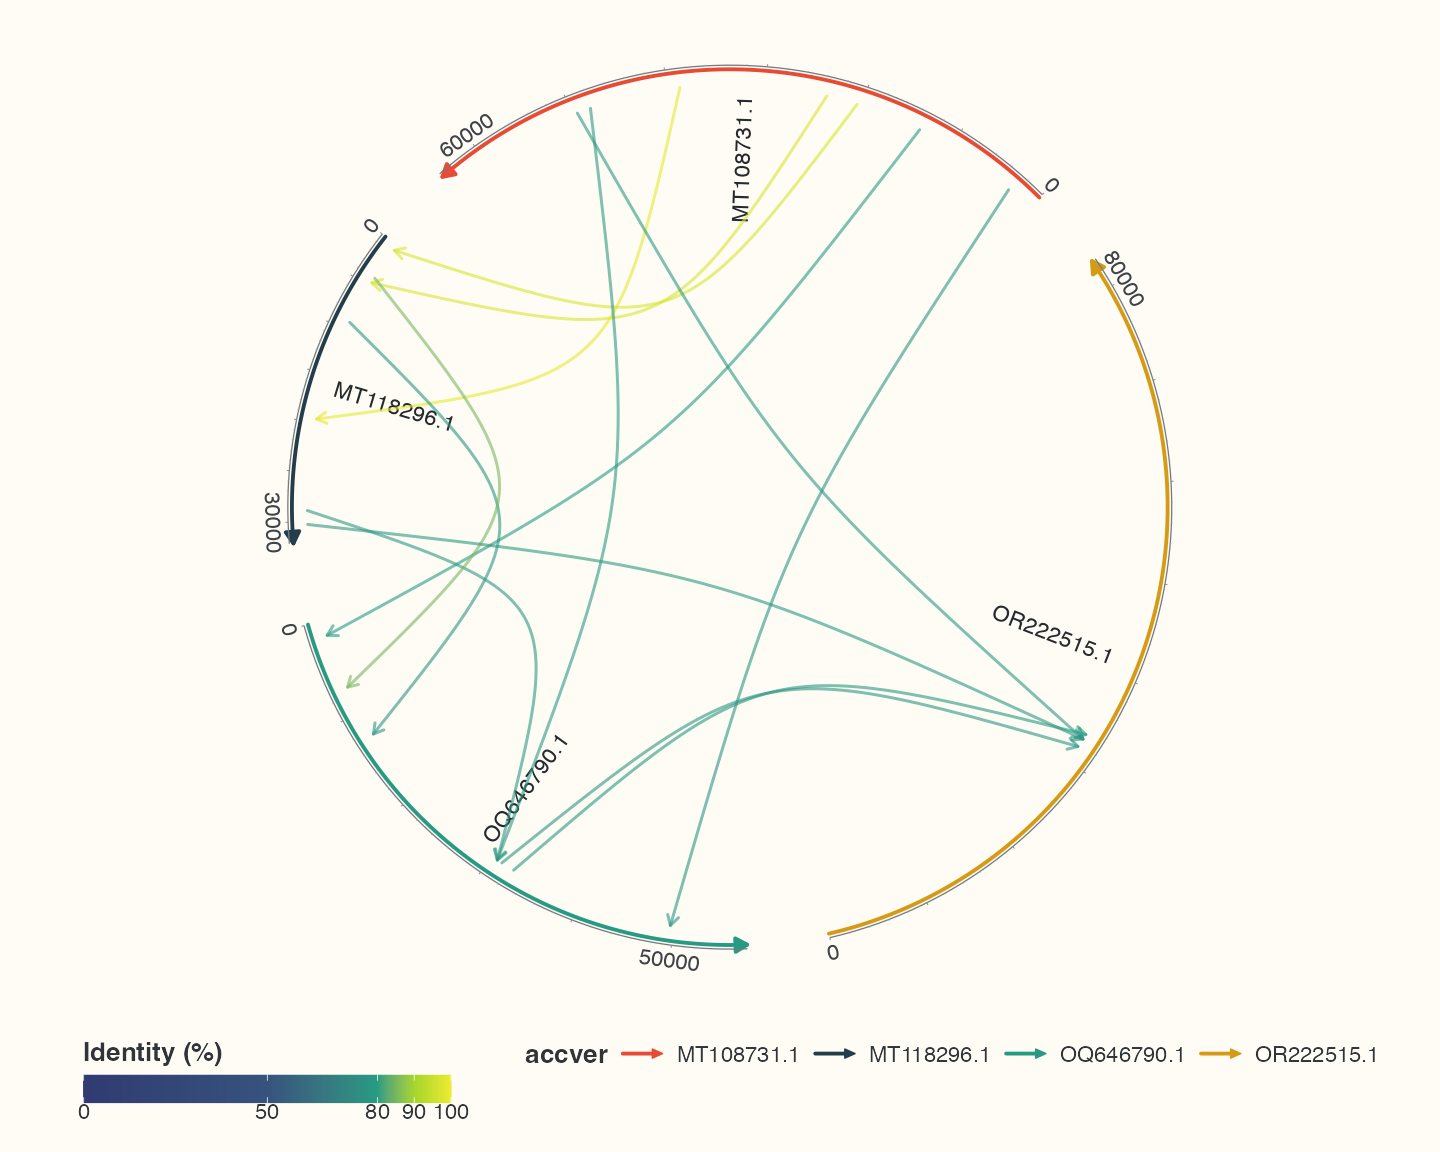
Point positions are integer midpoints of real bundled HSPs; identity remains the reported pident. Lines use qpos/spos, not interval ends, and an arrow points from query to subject. The line default avoidance is none; ribbon avoidance is uniform. Global chord rotation belongs to the coordinate system. Pair selection and adjacent-row defaults in linear plots are covered in three modes.
The point-link colour scale supplies available_aes = "link_colour" to its colourbar explicitly. Ordinary ggplot2 colourbars and the wrapper default do not accept every extended role; choose the matching role when making a custom guide.
Check your result
Inspect each report and member rows before reading the plot. Aggregated bands are not new alignments; point links summarize midpoints of existing HSPs.