Site guide · find your task
Features, stacking and genomic decoration
On this page
Draw real annotations as independent layers, choose suitable shapes and share stacking positions between overlapping intervals and text.
Prepare this page
In a fresh R session, run the code below, then follow this page in order. Colours and layout are optional display choices; inputs select only the fields needed.
Preparation code — run once on this page
Code
library(ggchord)
library(dplyr)
data(seq_data_example)
data(ribbon_data_example)
data(gene_data_example)
seqs <- seq_data_example |>
  select(accver, length)
links <- ribbon_data_example |>
  select(qaccver, saccver, qstart, qend, sstart, send)
# The fixture preserves biological strands separately from its old display strands.
genes <- gene_data_example |>
  transmute(accver, start, end, strand = source_strand)

# Optional appearance choices; none of these columns or scales is required input.
library(ggchord)
seq_palette <- setNames(
  c("#E64B35", "#233E4A", "#269B82", "#D59B17"),
  c("MT108731.1", "MT118296.1", "OQ646790.1", "OR222515.1")
)
gene_palette <- c("+" = "#CE1536", "-" = "#346B9D", "." = "#8291A6")

library(ggchord)
feature_palette <- c(
  CDS = "#993366", promoter = "#31849B", rep_origin = "#F1E51D",
  primer_bind = "#A020F0", misc_feature = "#A6ACB3", protein_bind = "#31849B"
)

library(ggchord)
doc_background <- "#FFFCF5"
identity_palette <- c("#303B71", "#36537D", "#269B82", "#A5D52C", "#ECEB31")
identity_values <- c(0, 0.5, 0.8, 0.9, 1)
identity_breaks <- c(0, 50, 80, 90, 100)
doc_legend_theme <- theme(
  legend.title = element_text(size = 13, face = "bold"),
  legend.text = element_text(size = 11),
  legend.key.width = unit(9, "mm"), legend.key.height = unit(5, "mm"),
  legend.spacing.x = unit(9, "mm"), legend.spacing.y = unit(7, "mm"),
  legend.margin = margin(l = 4, r = 4, unit = "mm")
)
sequence_guide <- guide_ggchord_legend(nrow = 1, theme = doc_legend_theme)
strand_guide <- guide_ggchord_legend(
  nrow = 1, override.aes = list(strand = c("+", "-")), theme = doc_legend_theme
)
identity_guide <- guide_ggchord_colourbar(
  position = "left", direction = "vertical",
  theme = theme(
    legend.key.height = unit(75, "mm"), legend.key.width = unit(5, "mm"),
    legend.title = element_text(size = 13, face = "bold"),
    legend.text = element_text(size = 11), legend.margin = margin(r = 7, unit = "mm")
  )
)
doc_theme <- theme_ggchord_publication(
  axis.text = element_text(size = 11),
  axis.text.check.overlap = TRUE
) +
  theme(
    legend.position = "bottom",
    legend.title = element_text(size = 13, face = "bold"),
    legend.text = element_text(size = 11),
    legend.key.width = unit(9, "mm"), legend.key.height = unit(5, "mm"),
    legend.spacing.x = unit(9, "mm"), legend.spacing.y = unit(7, "mm"),
    legend.box.spacing = unit(6, "mm"),
    plot.background = element_rect(fill = doc_background, colour = NA),
    panel.background = element_blank(),
    plot.title = element_text(face = "bold", size = 18),
    plot.subtitle = element_text(size = 10, colour = "#5C625A"),
    plot.margin = margin(14, 18, 14, 18)
  )
doc_axis <- function(coordinates = "relative") {
  scale_seq_position_continuous(
    coordinates = coordinates, n.breaks = 3, minor_breaks = NULL,
    labels = function(x) format(x, scientific = FALSE, big.mark = ",", trim = TRUE)
  )
}

library(dplyr)
data(plasmid_example_pUC19)
plasmid_seq <- plasmid_example_pUC19 |>
  select(accver, length)
feature_source <- find_common_features(plasmid_example_pUC19)
features <- feature_source |>
  select(accver, start, end, strand, type, anno)
Preserve feature semantics
The preparation above loads the actual pUC19 annotations; the circular example introduces their roles. This table retains actual overlapping pUC19 annotations and unknown strands. Geometry and fill map separately from the same category; an explicit fixed shape would override shape mapping.
Code
stack_features <- features |>
  select(accver, start, end, strand, type, anno)
stack_position <- position_feature_stack(spacing = .12)
feature_shapes <- setNames(ifelse(names(feature_palette) == "CDS", "arrow", "block"), names(feature_palette))
p_stack <- ggchord(seq_data = plasmid_seq) +
  geom_seq(show.legend = FALSE) +
  geom_feature(aes(feature_fill = type, feature_shape = type),
    data = stack_features,
    width = .08, position = stack_position
  ) +
  geom_feature_label_repel(data = stack_features, position = stack_position, size = 3.8, label_fit = "shrink", label_min_size = 2.8) +
  scale_feature_shape_manual(values = feature_shapes) +
  scale_feature_fill_manual(values = feature_palette) +
  coord_collinear() +
  doc_axis() +
  doc_theme
p_stack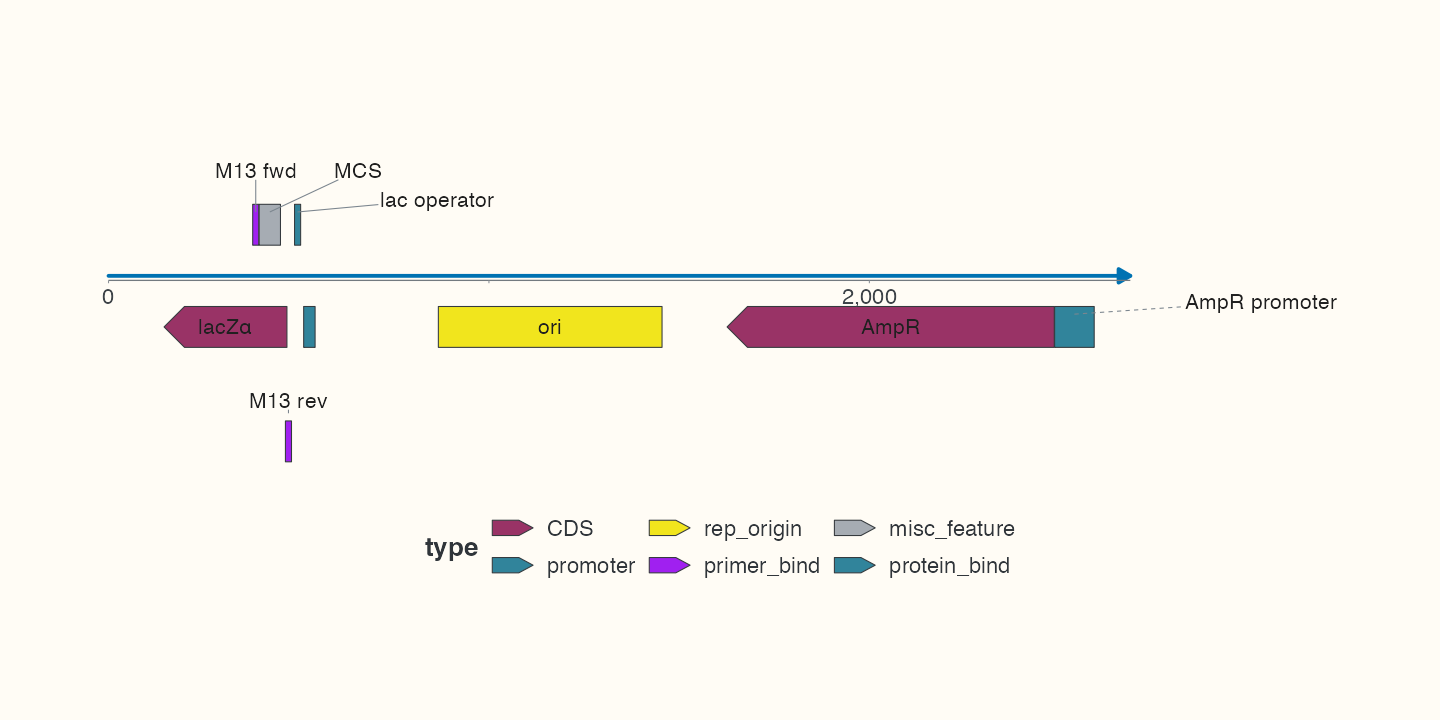
position_feature_stack() resolves overlapping annotation lanes. The label layer uses the same Position, so text anchors follow those lanes. Prefer unique feature_id values for subset/reordered label inputs. The strict gene shortcut requires known +/-; general features retain unknown/bidirectional semantics.
Choose shapes by meaning
| Geometry | Typical use | Important distinction |
|---|---|---|
arrow, compact_arrow
|
Directional coding/feature interval | Known direction is evidence, not a display guess |
block, capped_line
|
Region or unfilled interval | Shape choice does not infer biological function |
promoter_arrow, primer_arrow, primer_arc
|
Declared promoter/primer-style annotation | Computational matching and drawing are separate |
marker, chevron, lollipop
|
Custom interval/point-like emphasis | Keep real interval metadata; display shape is a mapping |
geom_gene() and geom_feature_plasmid() are useful presets, not aliases with identical defaults. Use position_strand() for signed offsets and position_plasmid() as a circular placement preset; the latter is not a fourth coordinate mode.
Highlight an interval without rewriting observations
Code
regions <- tibble(
  accver = links$qaccver[1], start = min(links$qstart[1], links$qend[1]),
  end = max(links$qstart[1], links$qend[1]), category = "alignment interval"
)
p_decorated <- ggchord(seq_data = seqs, ribbon_data = links) +
  geom_seq_region(aes(region_fill = category), data = regions, colour = NA) +
  geom_link_ribbon(fill = "#6BAFA6", alpha = .4) +
  geom_seq() +
  geom_seq_label(size = 4) +
  scale_region_fill_manual(values = c("alignment interval" = "#F4D35E")) +
  scale_seq_colour_manual(values = seq_palette) +
  geom_seq_scale(length = 10000) +
  coord_collinear() +
  doc_axis() +
  doc_theme
p_decorated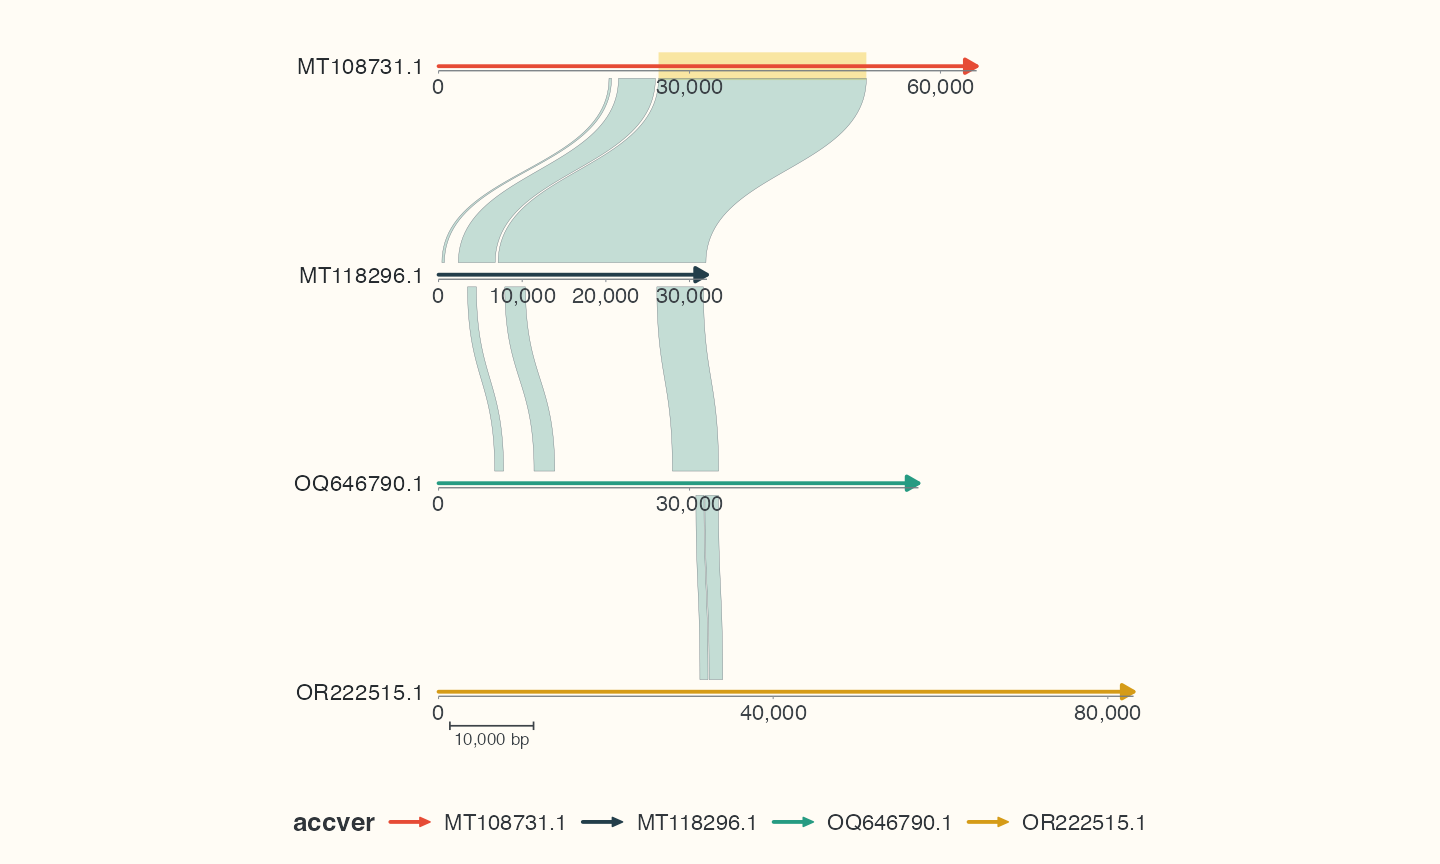
A region overlay uses its own table and region_fill scale. geom_seq_label() names sequences, geom_seq_center_label() supplies name/length in a single circle, and geom_seq_break() marks cropped/segmented ends. geom_seq_scale() is an independent bp reference bar for collinear plots; it differs from scale_seq_position_continuous(), which controls genomic axes on sequences. An ordinary ggplot2 annotation should use position mapping instead of treating bp as Cartesian x/y.
Check your result
Check intervals and strands before shapes and labels. Unknown strands remain in general features; stacking changes display placement, not genomic coordinates.