Site guide · find your task
3.4 Thirteen plasmid references
On this page
- Prepare all cases once
- Inputs and recognition results
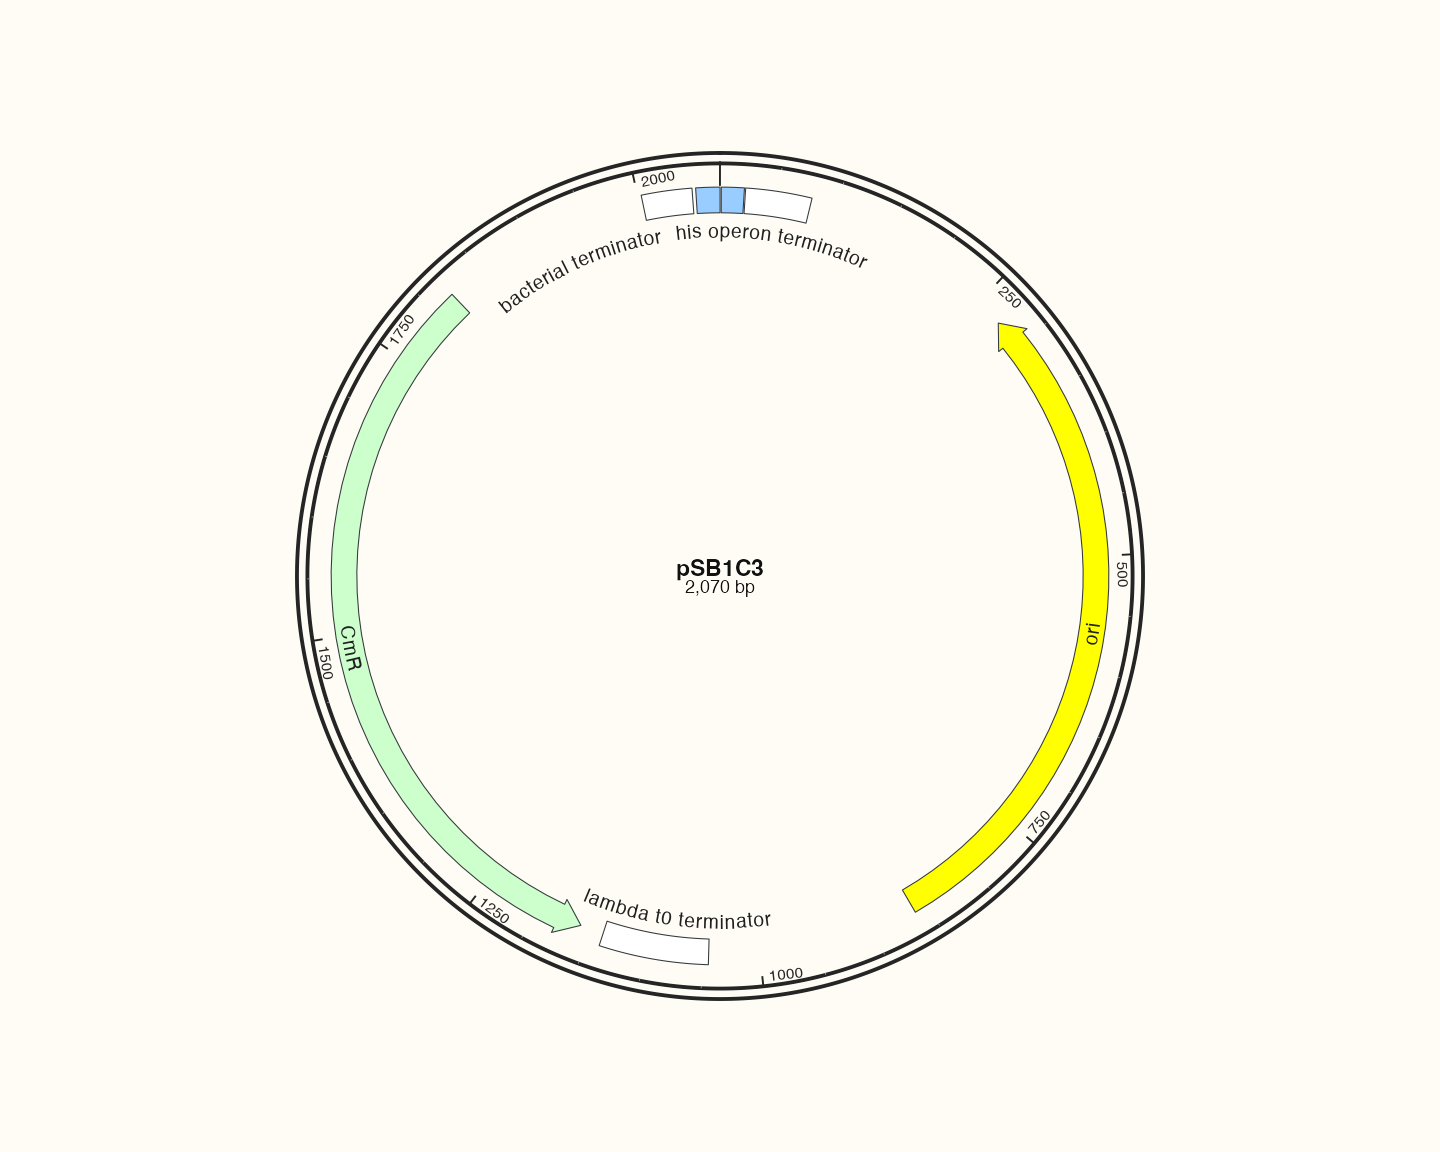
- pSB1C3: Small vector and basic structure
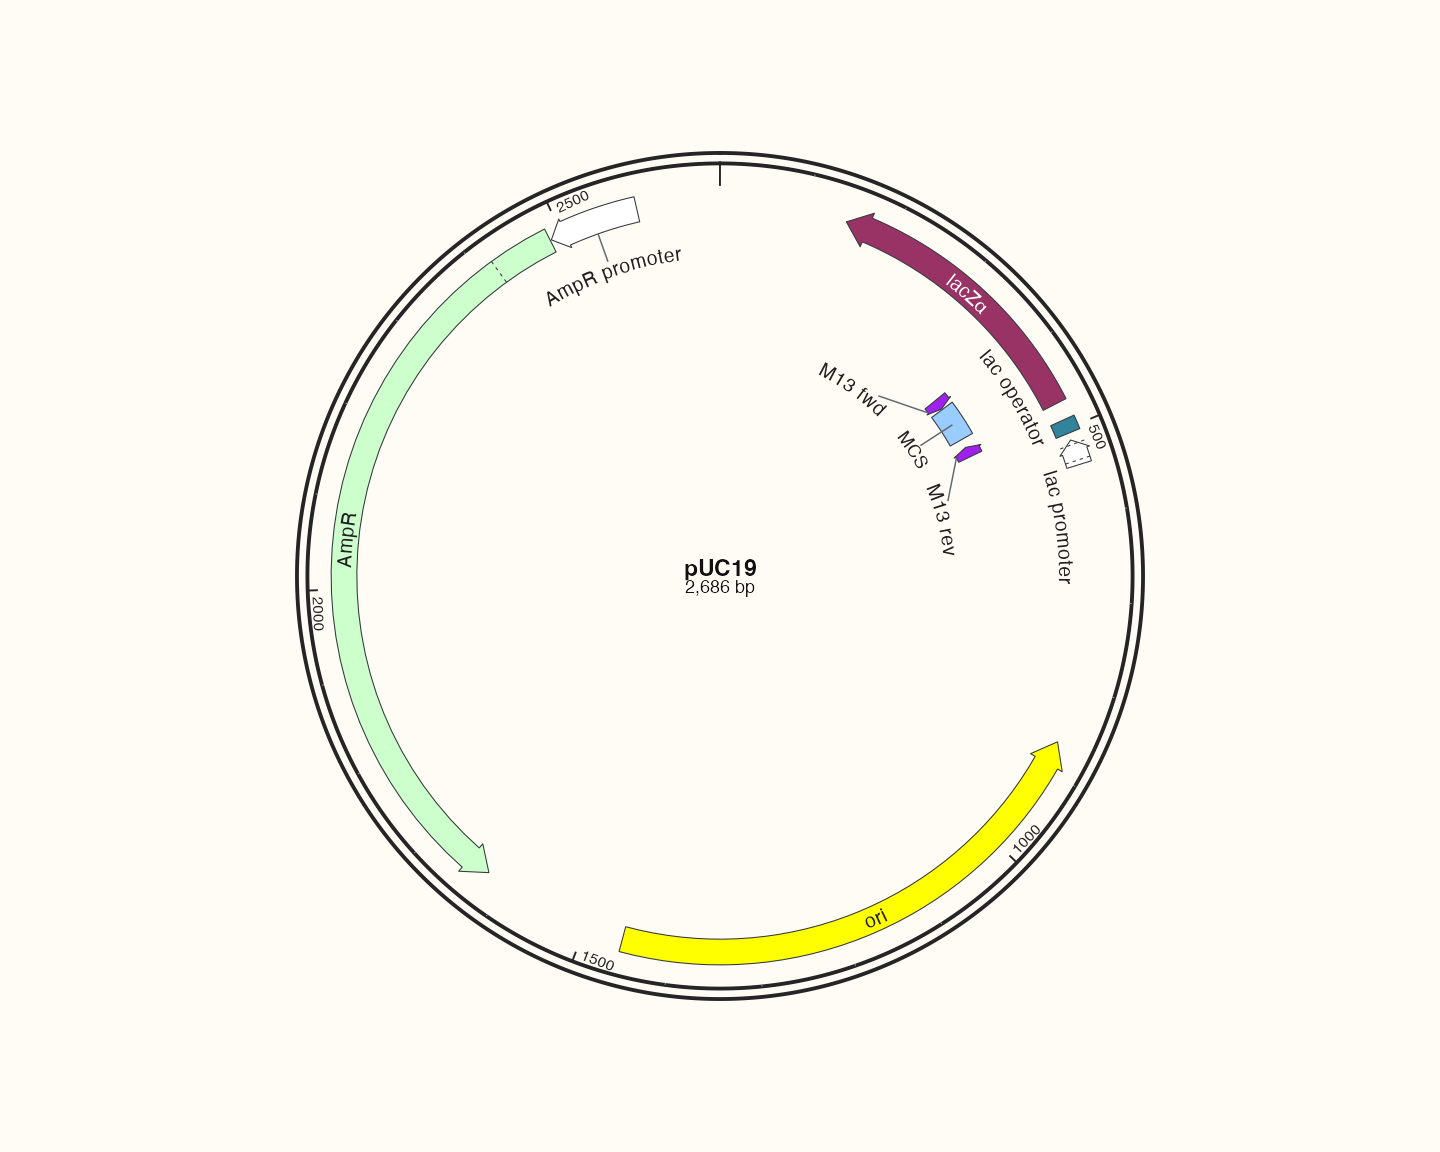
- pUC19: Common features and replication origin
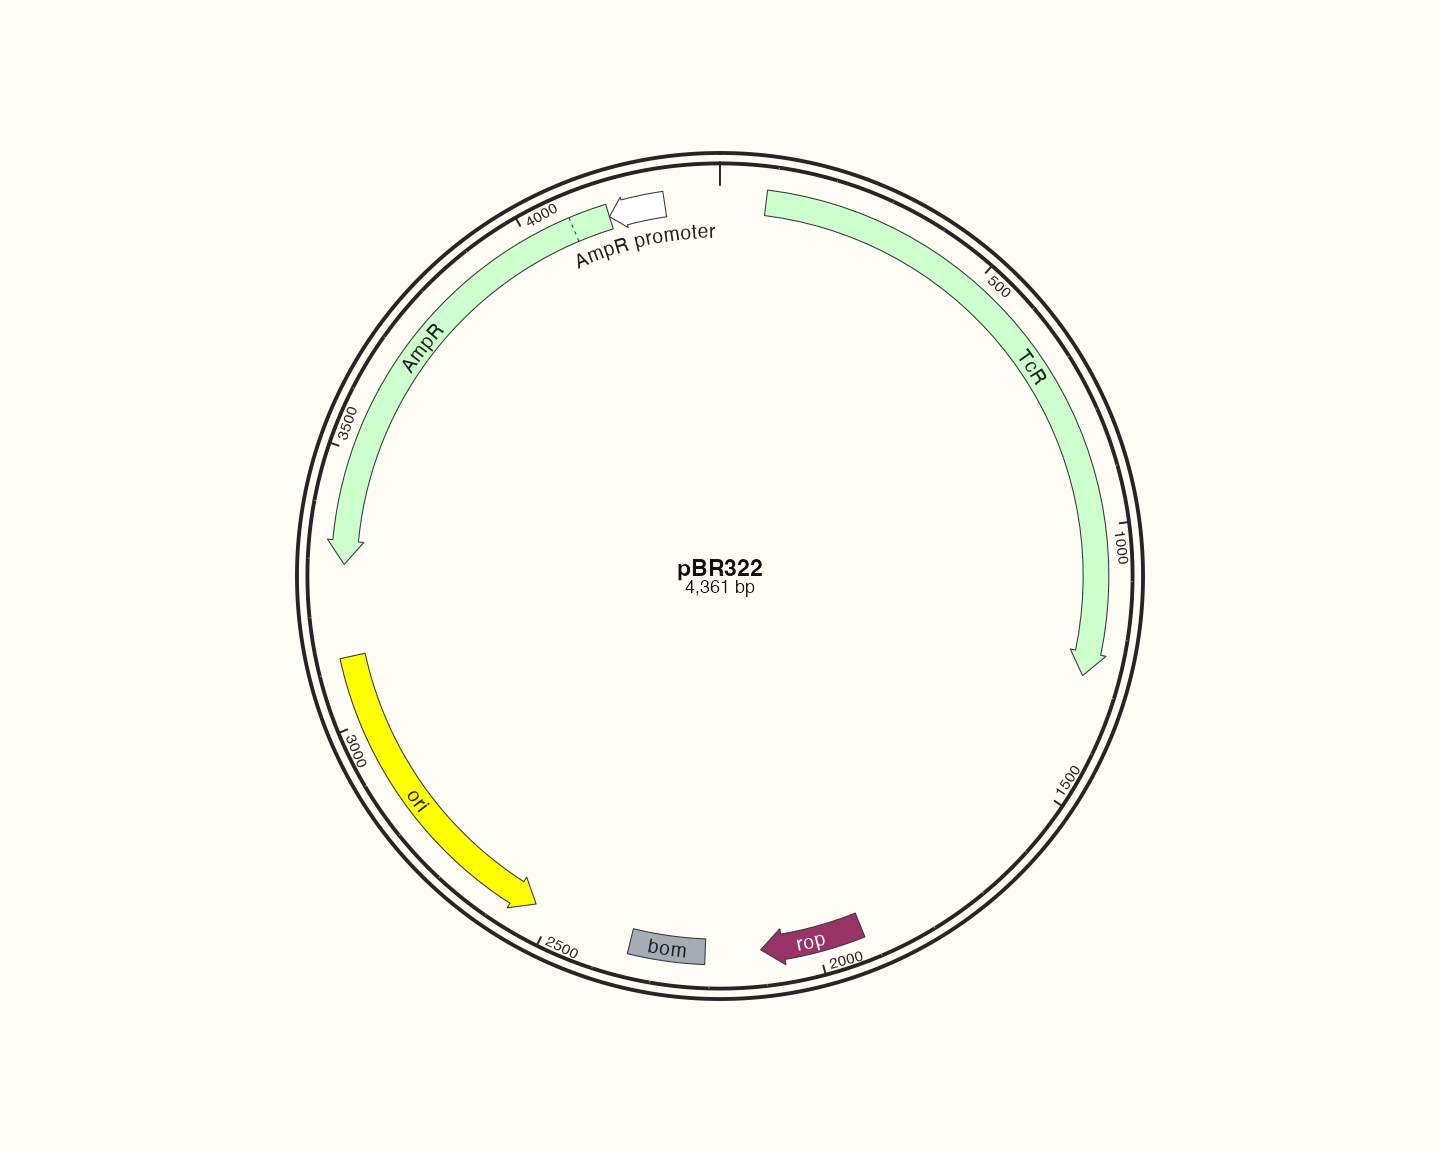
- pBR322: Multiple resistance regions and direction
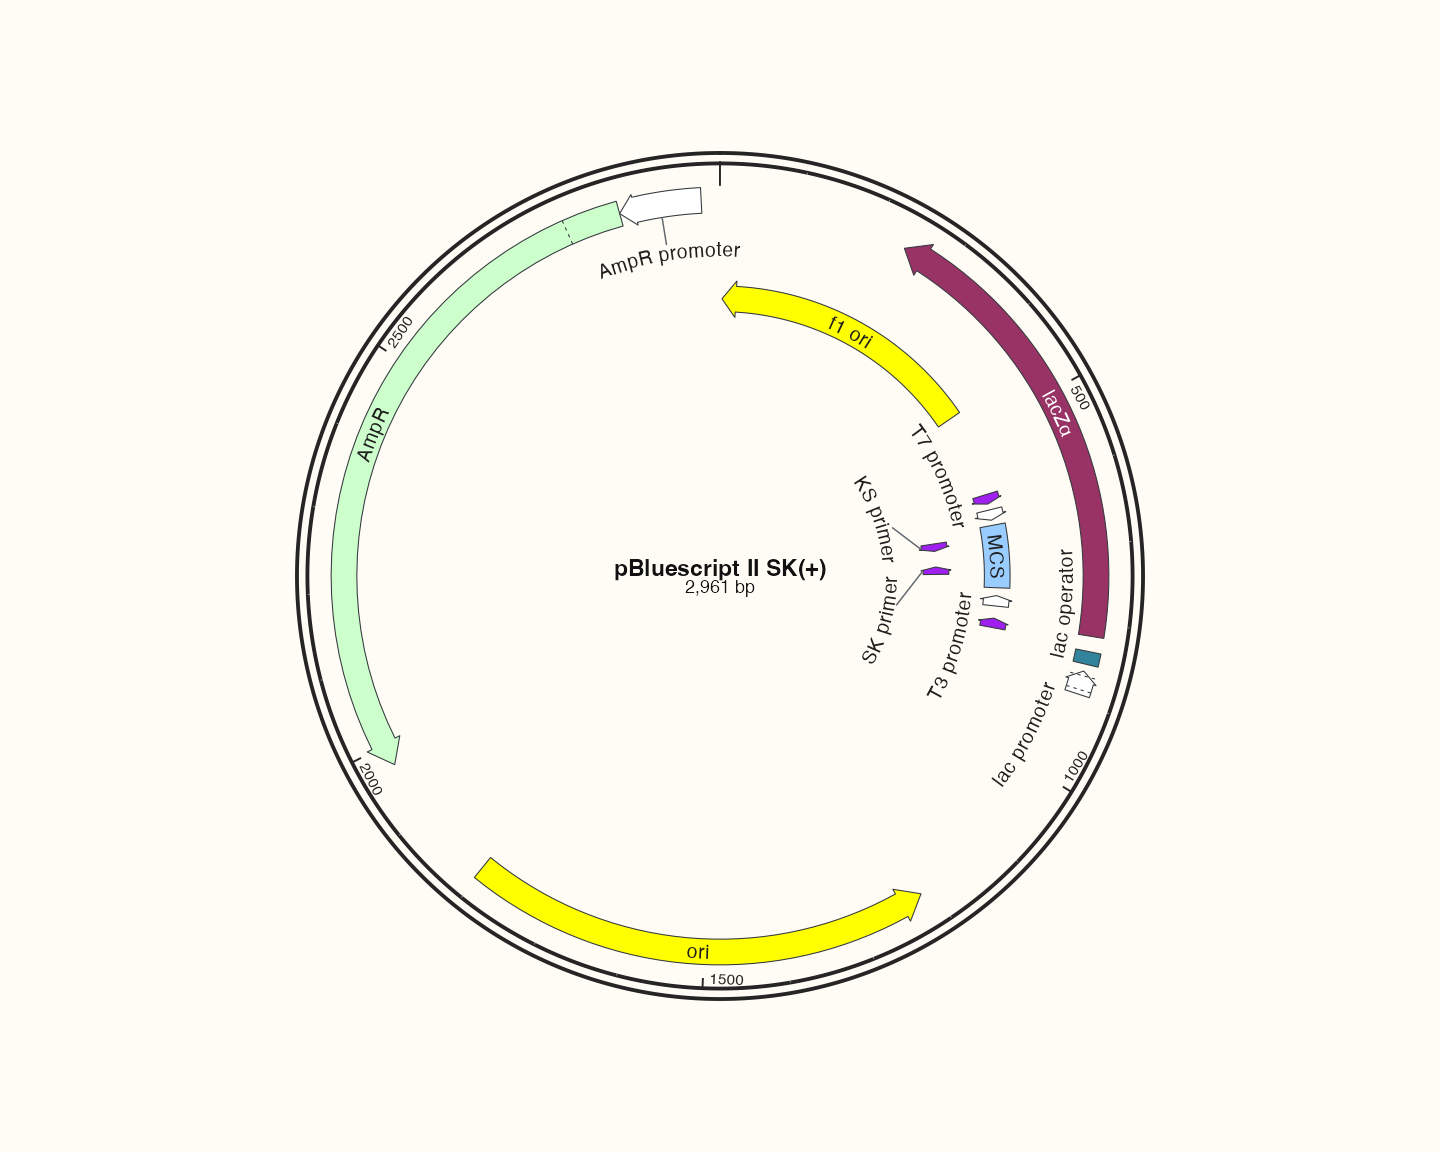
- pBluescript II SK(+): Local regulation and short features
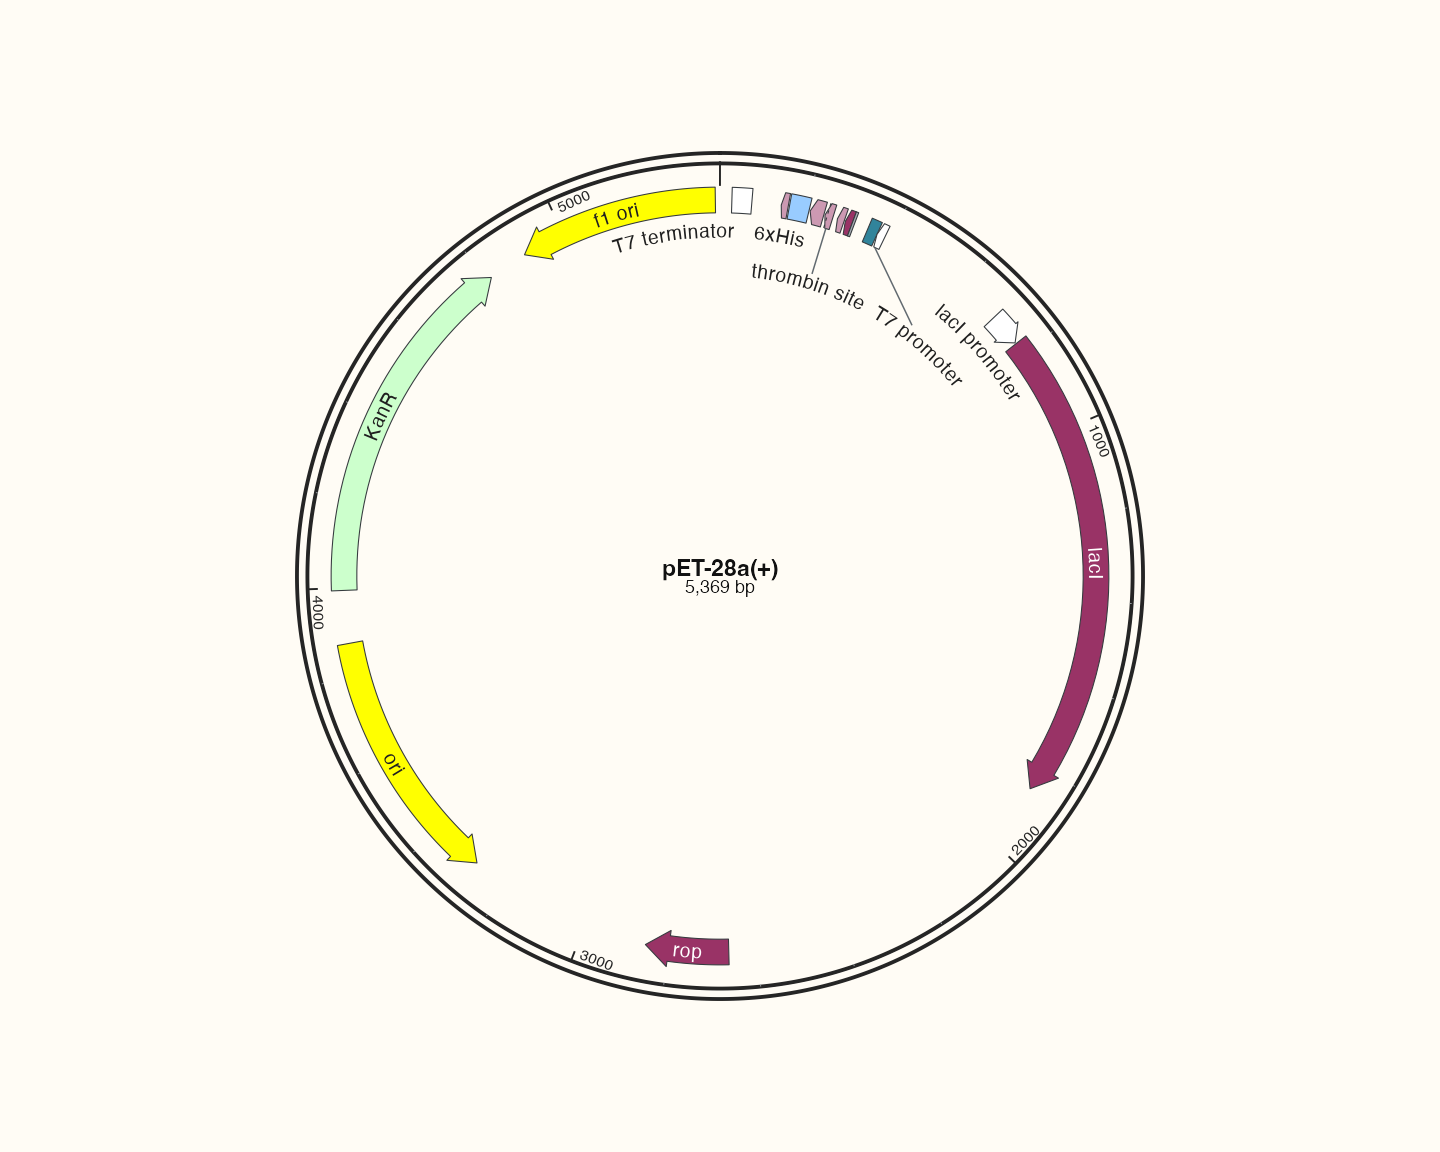
- pET-28a(+): Expression regions and tags
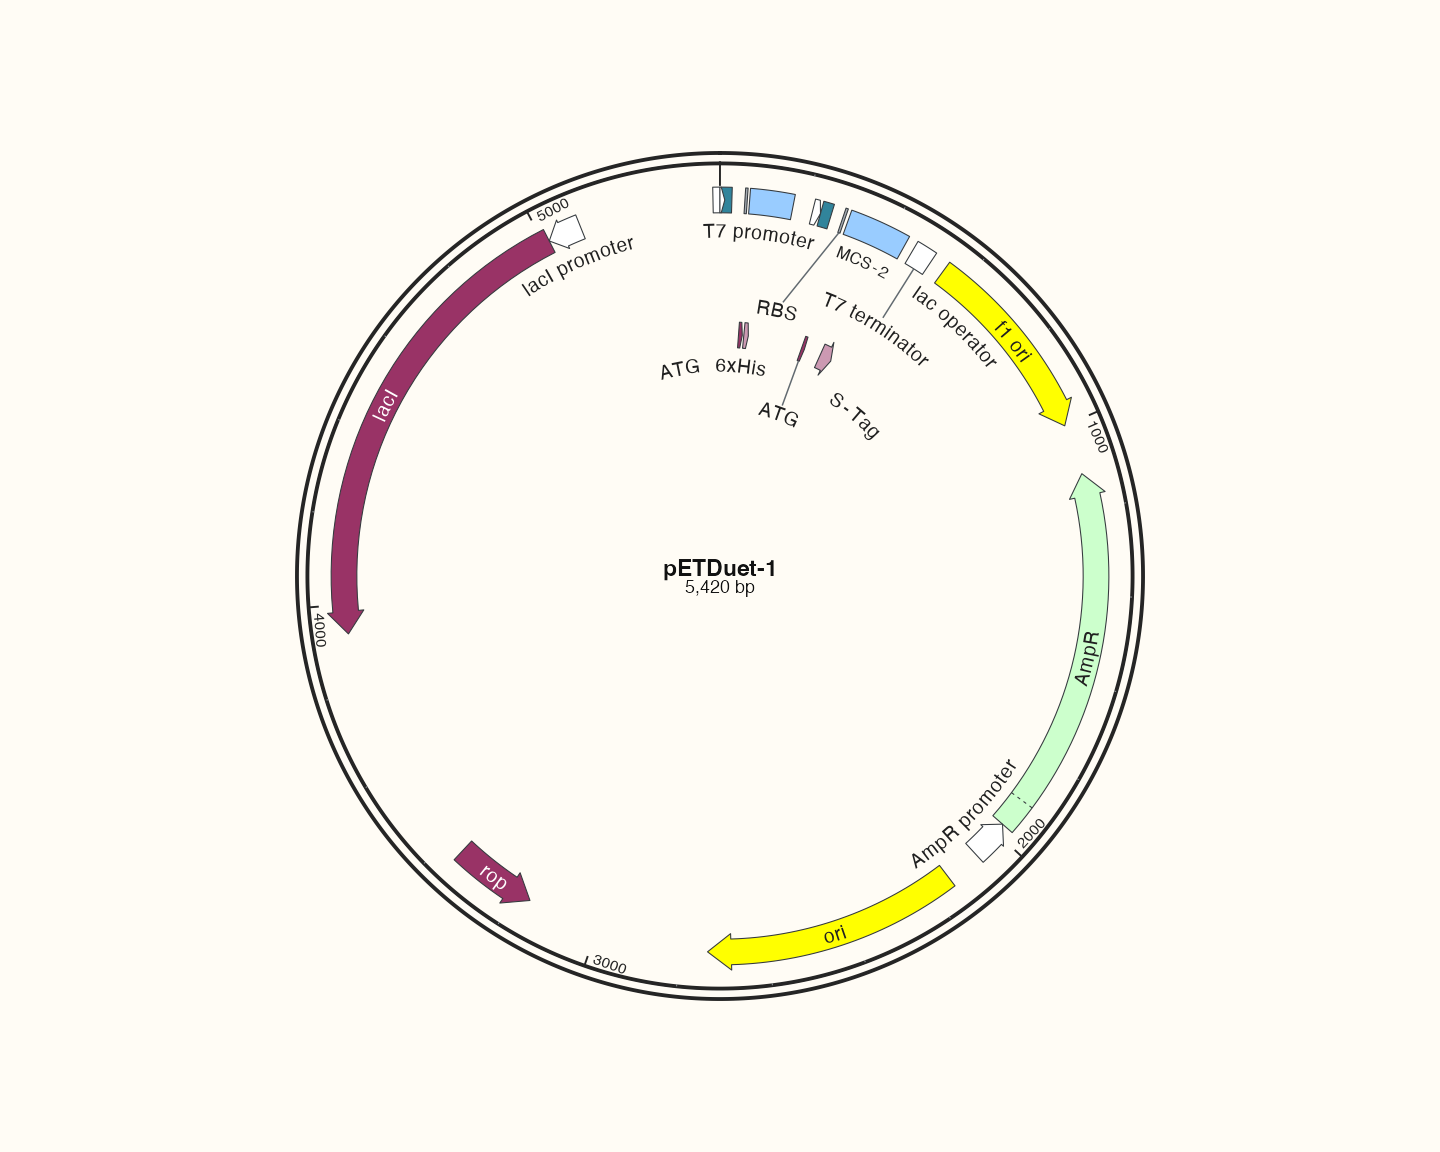
- pETDuet-1: Dual expression units; transition to the dense case
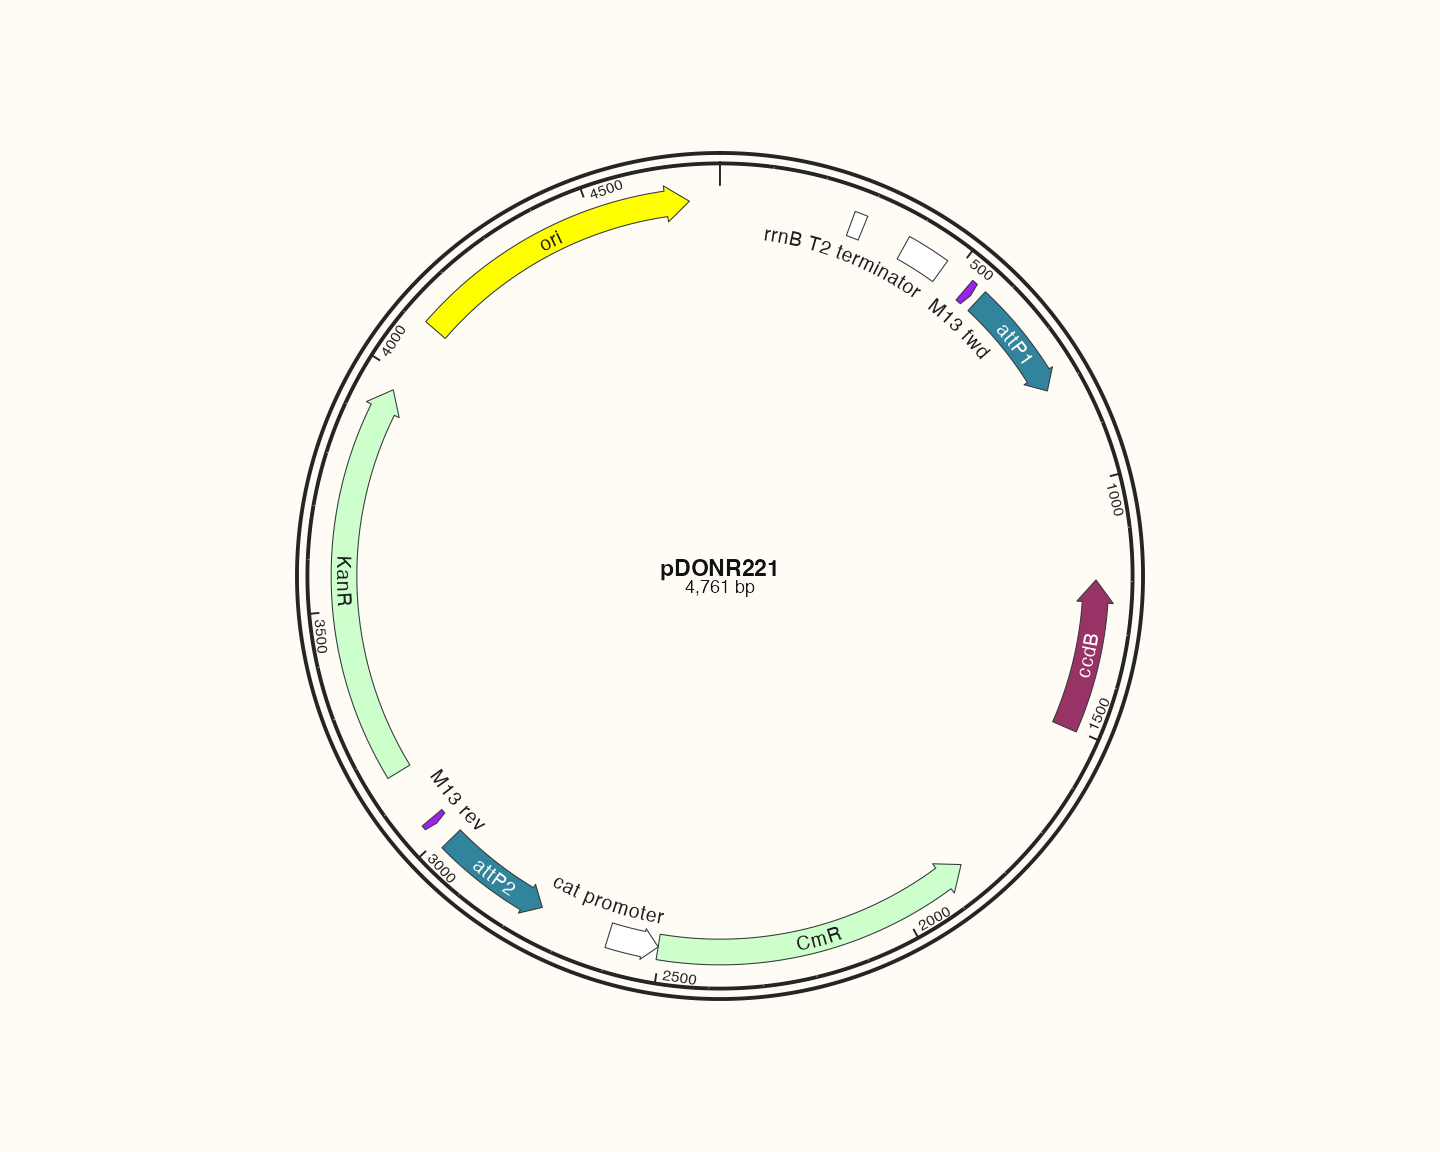
- pDONR221: Recombination-related architecture
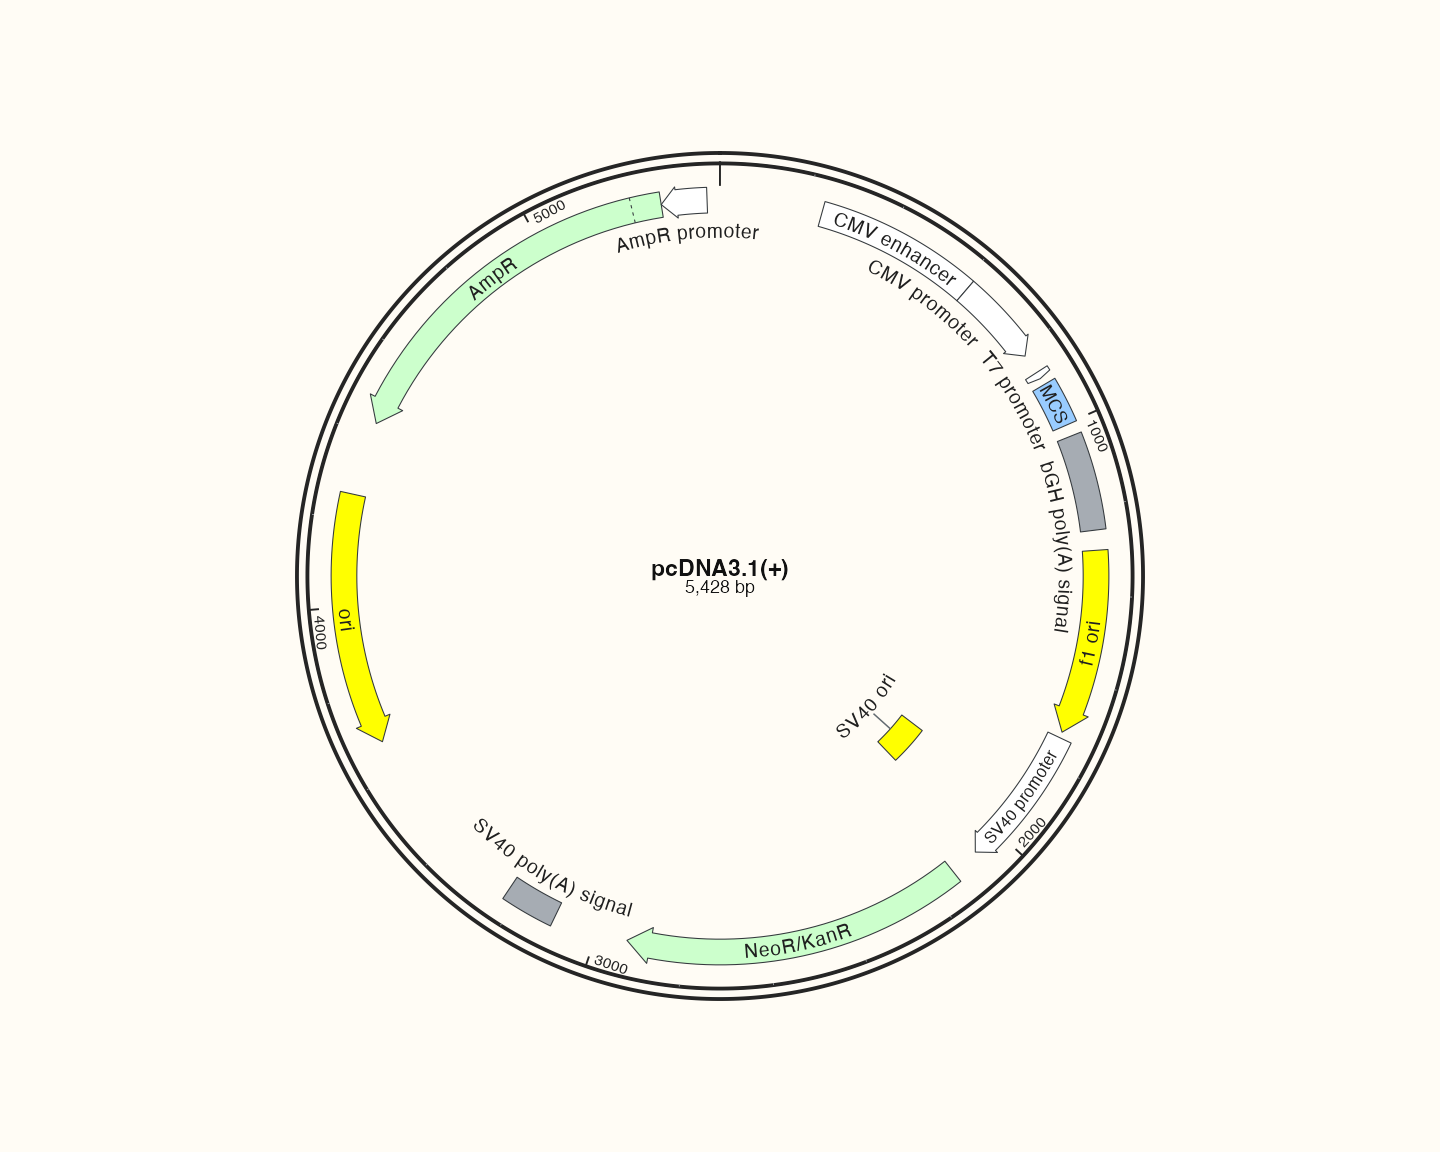
- pcDNA3.1(+): Annotation hierarchy in an expression vector
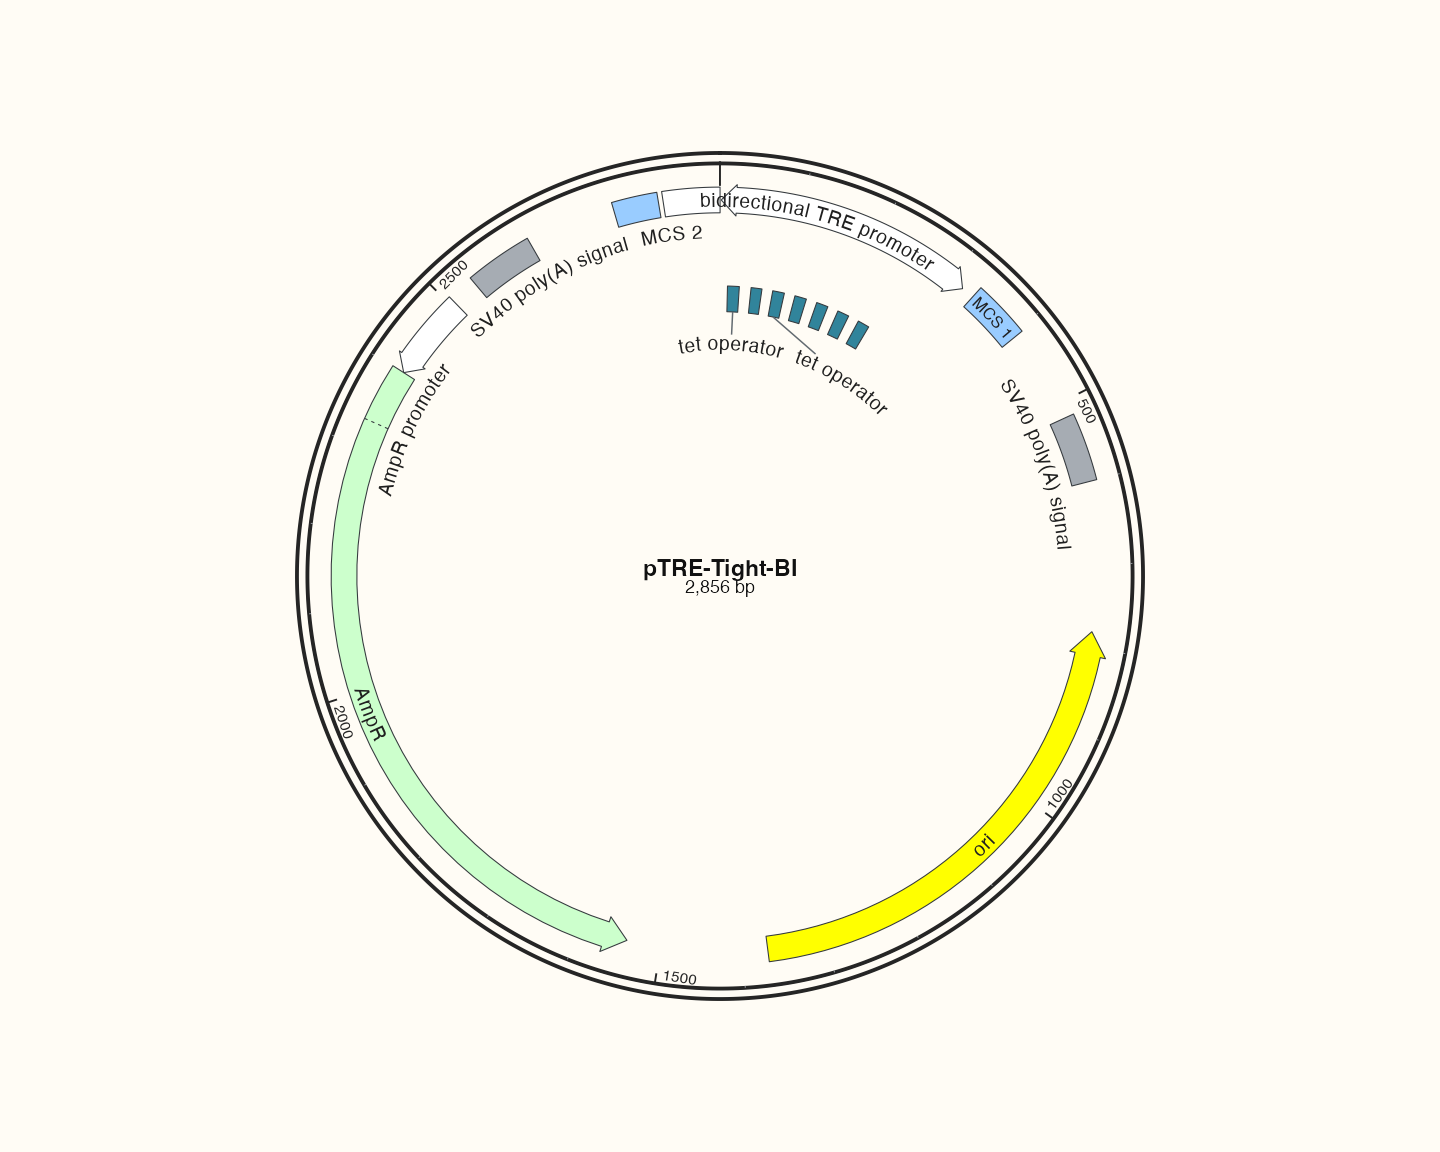
- pTRE-Tight-BI: Bidirectional regulatory structure
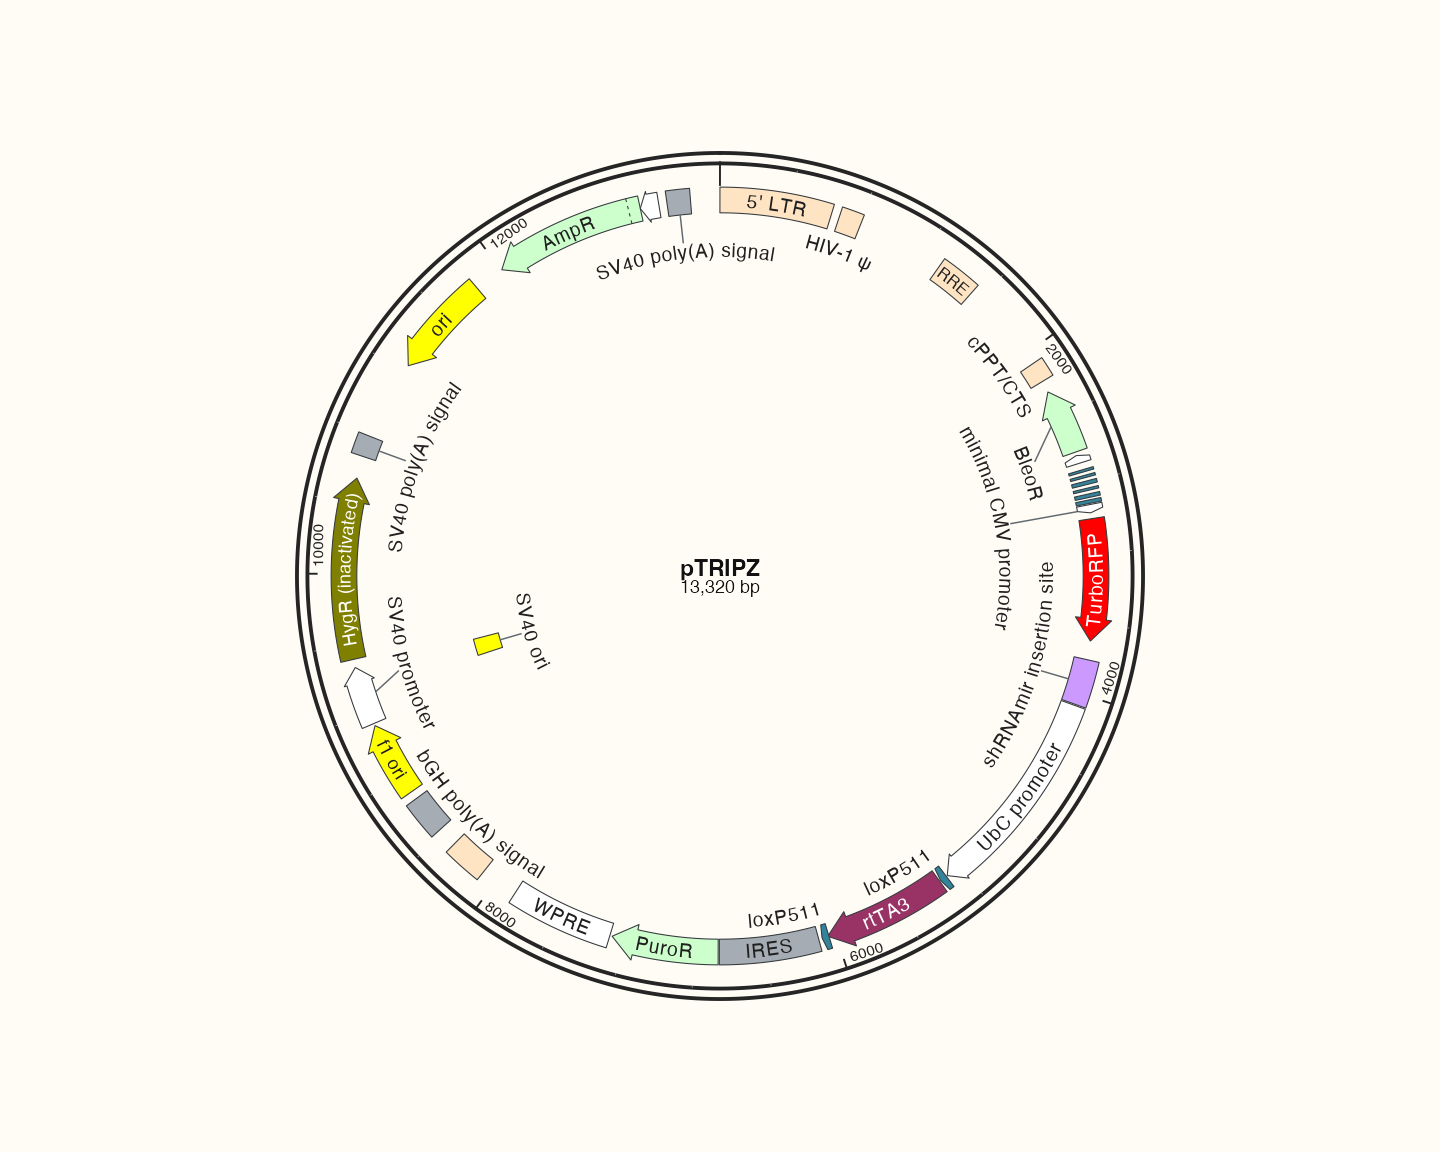
- pTRIPZ: Display density on a longer sequence
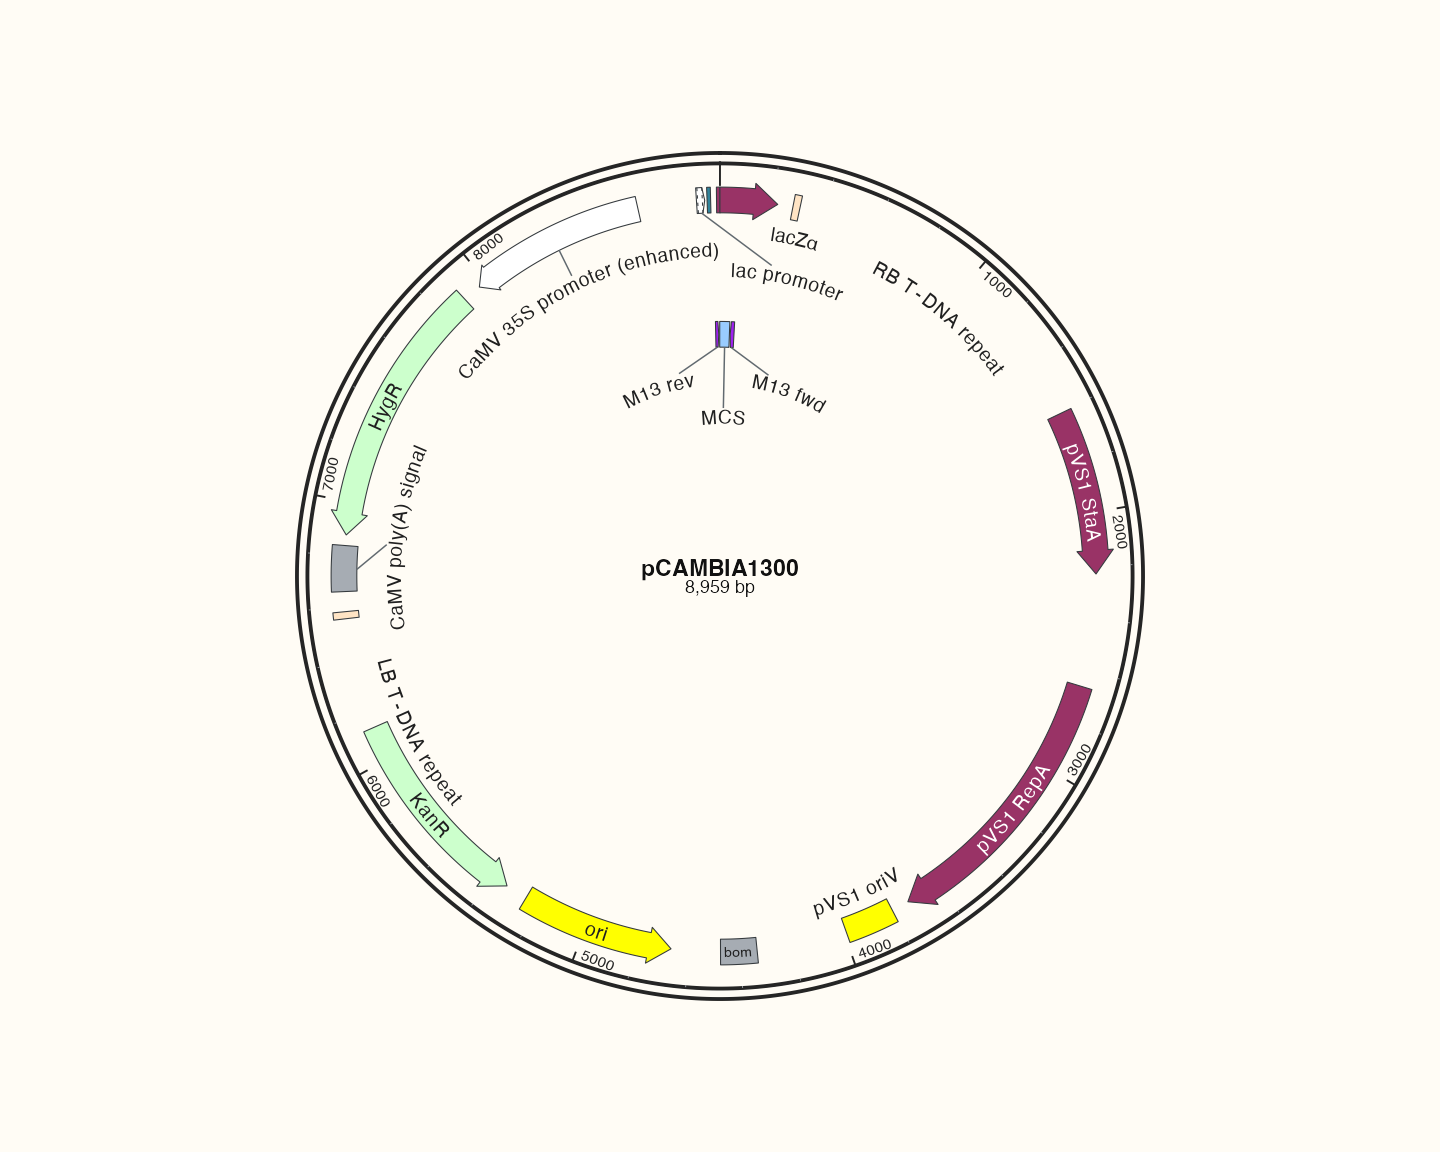
- pCAMBIA1300: Architecture of a larger plant vector
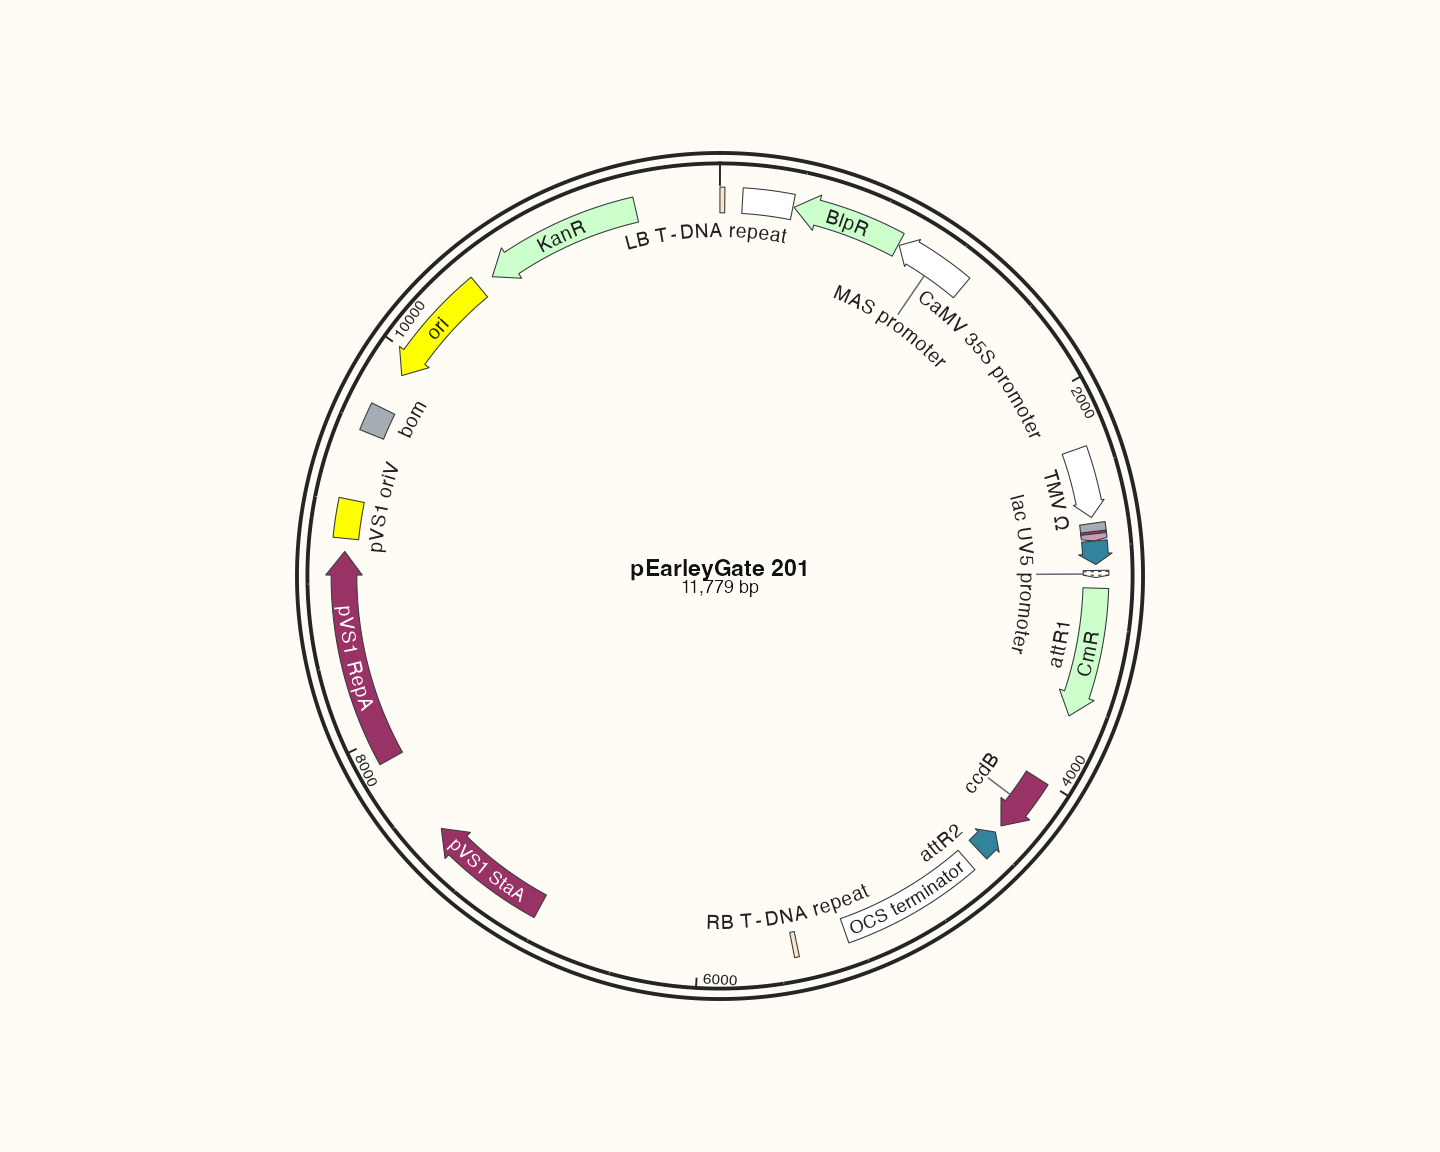
- pEarleyGate 201: Category comparison with another plant vector
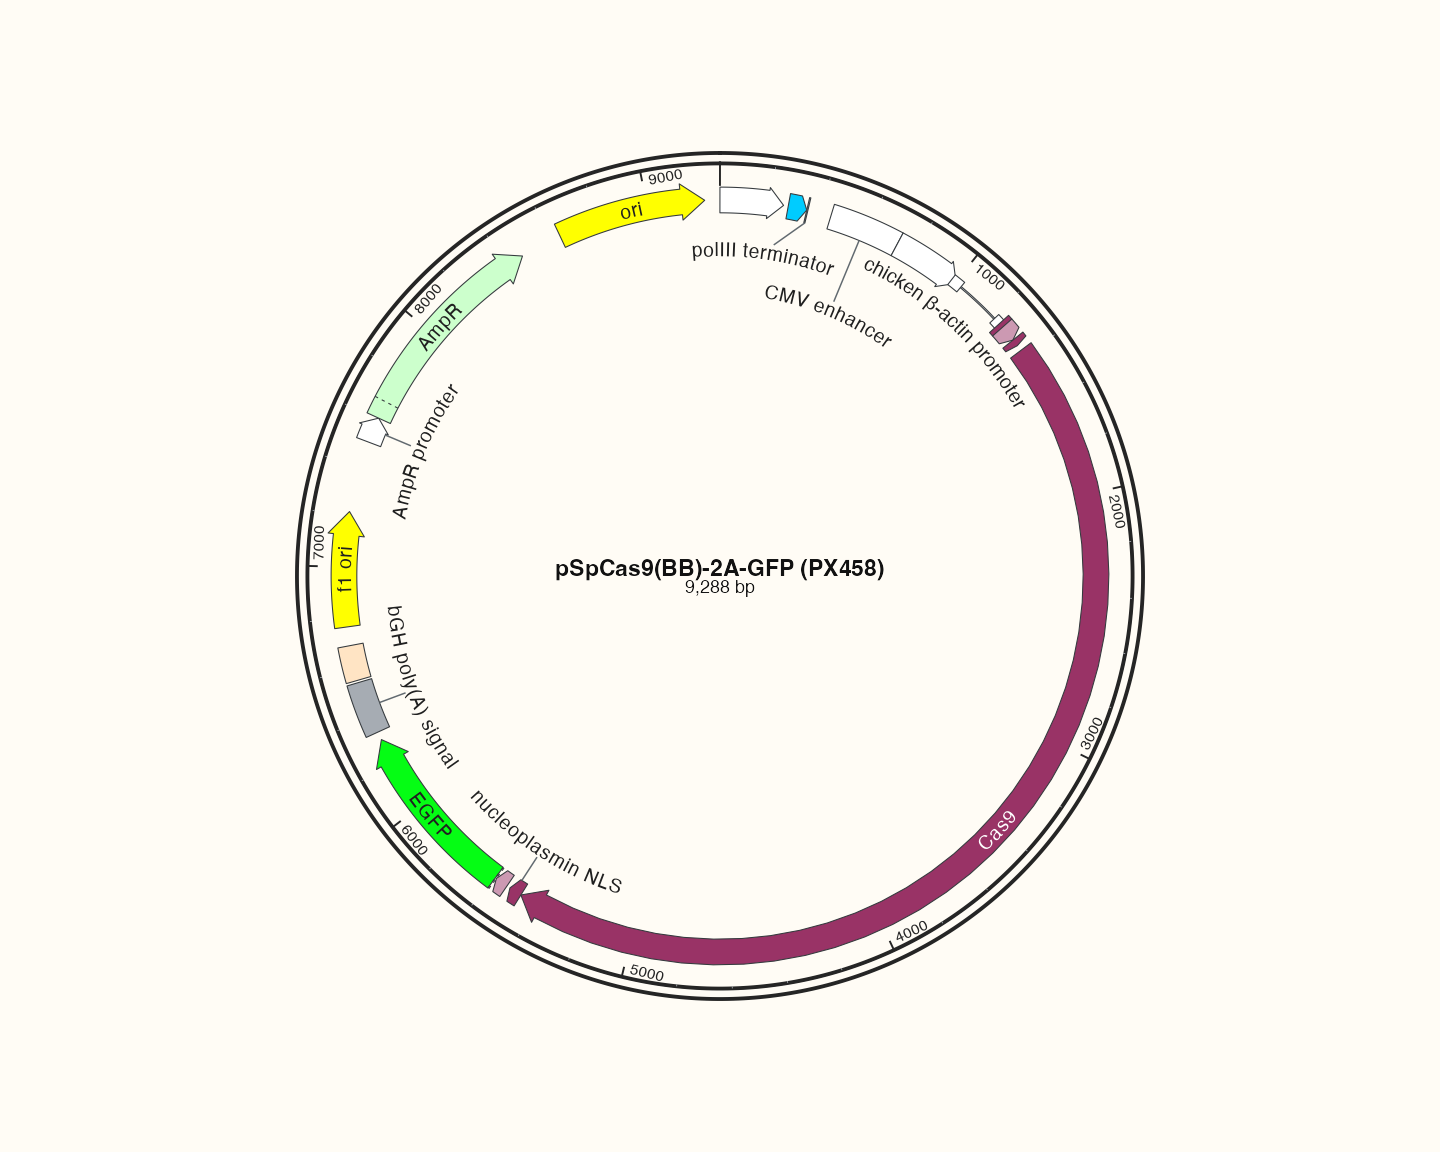
- pSpCas9(BB)-2A-GFP (PX458): Large expression vector and label fitting
- Next
This gallery contains all 13 unique repository FASTA reference records, redrawn with current code. Historical PNGs and .dna files are not these outputs. Vector roles provide learning prompts rather than experimental validation. Bundled records and their generation rules retain source identity and lengths.
Prepare all cases once
Preparation code — run once on this page
Code
library(ggchord)
doc_background <- "#FFFCF5"
identity_palette <- c("#303B71", "#36537D", "#269B82", "#A5D52C", "#ECEB31")
identity_values <- c(0, 0.5, 0.8, 0.9, 1)
identity_breaks <- c(0, 50, 80, 90, 100)
doc_legend_theme <- theme(
  legend.title = element_text(size = 13, face = "bold"),
  legend.text = element_text(size = 11),
  legend.key.width = unit(9, "mm"), legend.key.height = unit(5, "mm"),
  legend.spacing.x = unit(9, "mm"), legend.spacing.y = unit(7, "mm"),
  legend.margin = margin(l = 4, r = 4, unit = "mm")
)
sequence_guide <- guide_ggchord_legend(nrow = 1, theme = doc_legend_theme)
strand_guide <- guide_ggchord_legend(
  nrow = 1, override.aes = list(strand = c("+", "-")), theme = doc_legend_theme
)
identity_guide <- guide_ggchord_colourbar(
  position = "left", direction = "vertical",
  theme = theme(
    legend.key.height = unit(75, "mm"), legend.key.width = unit(5, "mm"),
    legend.title = element_text(size = 13, face = "bold"),
    legend.text = element_text(size = 11), legend.margin = margin(r = 7, unit = "mm")
  )
)
doc_theme <- theme_ggchord_publication(
  axis.text = element_text(size = 11),
  axis.text.check.overlap = TRUE
) +
  theme(
    legend.position = "bottom",
    legend.title = element_text(size = 13, face = "bold"),
    legend.text = element_text(size = 11),
    legend.key.width = unit(9, "mm"), legend.key.height = unit(5, "mm"),
    legend.spacing.x = unit(9, "mm"), legend.spacing.y = unit(7, "mm"),
    legend.box.spacing = unit(6, "mm"),
    plot.background = element_rect(fill = doc_background, colour = NA),
    panel.background = element_blank(),
    plot.title = element_text(face = "bold", size = 18),
    plot.subtitle = element_text(size = 10, colour = "#5C625A"),
    plot.margin = margin(14, 18, 14, 18)
  )
doc_axis <- function(coordinates = "relative") {
  scale_seq_position_continuous(
    coordinates = coordinates, n.breaks = 3, minor_breaks = NULL,
    labels = function(x) format(x, scientific = FALSE, big.mark = ",", trim = TRUE)
  )
}
Code
library(ggchord)
library(dplyr)
library(purrr)
# Thirteen unique records; the compatibility spelling pUC19c is not an extra plasmid.
catalog_objects <- c(
  "plasmid_example_pSB1C3", "plasmid_example_pUC19", "plasmid_example_pBR322",
  "plasmid_example_pBluescript_II_SK_plus", "plasmid_example_pET_28a_plus",
  "plasmid_example_pETDuet_1", "plasmid_example_pDONR221",
  "plasmid_example_pcDNA3_1_plus", "plasmid_example_pTRE_Tight_BI",
  "plasmid_example_pTRIPZ", "plasmid_example_pCAMBIA1300",
  "plasmid_example_pEarleyGate_201", "plasmid_example_pSpCas9_BB_2A_GFP_PX458"
)
read_catalog_record <- function(object) {
  target <- new.env(parent = emptyenv())
  data(list = object, package = "ggchord", envir = target)
  target[[object]]
}
catalog_sequences <- map(catalog_objects, read_catalog_record)
catalog_features <- map(catalog_sequences, find_common_features)
catalog_summary <- map2(catalog_sequences, catalog_features, function(sequence, features) {
  tibble(accver = sequence$accver, length = sequence$length, features = nrow(features))
}) |>
  bind_rows()
Code
make_catalog_plot <- function(sequence, features) {
  placement <- position_feature_stack(spacing = 0.085, base_position = position_plasmid())
  ggchord(seq_data = sequence |> select(accver, length)) +
    geom_seq(seq_style = "double", colour = "#252525") +
    geom_feature_plasmid(data = features, position = placement) +
    geom_feature_label_repel(
      data = features, position = placement, external = FALSE,
      label_fit = "shrink", label_min_size = 2.5, max_overlaps = 0
    ) +
    geom_seq_center_label() +
    coord_circular(rotation = 90, fit = "manual", xlim = c(-1.35, 1.35), ylim = c(-1.35, 1.35)) +
    theme_ggchord_plasmid() +
    theme(
      panel.background = element_blank(),
      plot.background = element_rect(fill = doc_background, colour = NA)
    )
}
catalog_plots <- map2(catalog_sequences, catalog_features, make_catalog_plot)
names(catalog_plots) <- catalog_summary$accver
# Save any record at the same size used in the gallery.
# ggsave("pBR322.png", catalog_plots[["pBR322"]], width = 10, height = 8, dpi = 144)
One small function composes independent layers, retaining every recognition result in catalog_features. Actual counts appear below. These maps retain all feature geometry and fit labels inside, allowing labels to hide when space is insufficient; primers and dense restriction annotations are combined in the complete case. Save a named plot with the commented ggsave call.
Inputs and recognition results
| Reference | Length (bp) | Features |
|---|---|---|
| pSB1C3 | 2070 | 7 |
| pUC19 | 2686 | 9 |
| pBR322 | 4361 | 6 |
| pBluescript II SK(+) | 2961 | 14 |
| pET-28a(+) | 5369 | 16 |
| pETDuet-1 | 5420 | 20 |
| pDONR221 | 4761 | 11 |
| pcDNA3.1(+) | 5428 | 13 |
| pTRE-Tight-BI | 2856 | 15 |
| pTRIPZ | 13320 | 33 |
| pCAMBIA1300 | 8959 | 17 |
| pEarleyGate 201 | 11779 | 21 |
| pSpCas9(BB)-2A-GFP (PX458) | 9288 | 19 |
pSB1C3: Small vector and basic structure
pUC19: Common features and replication origin
pBR322: Multiple resistance regions and direction
pBluescript II SK(+): Local regulation and short features
pET-28a(+): Expression regions and tags
pETDuet-1: Dual expression units; transition to the dense case
pDONR221: Recombination-related architecture
pcDNA3.1(+): Annotation hierarchy in an expression vector
pTRE-Tight-BI: Bidirectional regulatory structure
pTRIPZ: Display density on a longer sequence
pCAMBIA1300: Architecture of a larger plant vector
pEarleyGate 201: Category comparison with another plant vector
pSpCas9(BB)-2A-GFP (PX458): Large expression vector and label fitting
Next
After comparing densities, continue to 3.5 The complete case, adding separate primer and restriction layers.