Site guide · find your task
Choose your learning module
On this page
Choose a layout for your question. The examples below compare three views using source-backed bundled records.
Which view should you choose?
| Task | Preferred view | Avoid this misreading |
|---|---|---|
| Overall relationships among several sequences | Chord | Crossings alone are not evidence of inversion |
| Annotations on one plasmid or circular sequence | Circular | Multiple sequences do not fit a single-sequence coordinate |
| Positions, gene order and local neighbourhoods | Collinear | Display alignment or flipping is not a biological conclusion |
All three consume existing data; none computes a new BLAST alignment. Try the minimal combinations below, then follow the raw-record workflow, complete plasmid map or local homolog comparison.
Prepare this page
In a fresh R session, run the code below, then follow this page in order. Colours and layout are optional display choices; inputs select only the fields needed.
Preparation code — run once on this page
Code
library(ggchord)
library(dplyr)
data(seq_data_example)
data(ribbon_data_example)
data(gene_data_example)
seqs <- seq_data_example |>
  select(accver, length)
links <- ribbon_data_example |>
  select(qaccver, saccver, qstart, qend, sstart, send)
# The fixture preserves biological strands separately from its old display strands.
genes <- gene_data_example |>
  transmute(accver, start, end, strand = source_strand)

# Optional appearance choices; none of these columns or scales is required input.
library(ggchord)
seq_palette <- setNames(
  c("#E64B35", "#233E4A", "#269B82", "#D59B17"),
  c("MT108731.1", "MT118296.1", "OQ646790.1", "OR222515.1")
)
gene_palette <- c("+" = "#CE1536", "-" = "#346B9D", "." = "#8291A6")

library(ggchord)
feature_palette <- c(
  CDS = "#993366", promoter = "#31849B", rep_origin = "#F1E51D",
  primer_bind = "#A020F0", misc_feature = "#A6ACB3", protein_bind = "#31849B"
)

library(ggchord)
doc_background <- "#FFFCF5"
identity_palette <- c("#303B71", "#36537D", "#269B82", "#A5D52C", "#ECEB31")
identity_values <- c(0, 0.5, 0.8, 0.9, 1)
identity_breaks <- c(0, 50, 80, 90, 100)
doc_legend_theme <- theme(
  legend.title = element_text(size = 13, face = "bold"),
  legend.text = element_text(size = 11),
  legend.key.width = unit(9, "mm"), legend.key.height = unit(5, "mm"),
  legend.spacing.x = unit(9, "mm"), legend.spacing.y = unit(7, "mm"),
  legend.margin = margin(l = 4, r = 4, unit = "mm")
)
sequence_guide <- guide_ggchord_legend(nrow = 1, theme = doc_legend_theme)
strand_guide <- guide_ggchord_legend(
  nrow = 1, override.aes = list(strand = c("+", "-")), theme = doc_legend_theme
)
identity_guide <- guide_ggchord_colourbar(
  position = "left", direction = "vertical",
  theme = theme(
    legend.key.height = unit(75, "mm"), legend.key.width = unit(5, "mm"),
    legend.title = element_text(size = 13, face = "bold"),
    legend.text = element_text(size = 11), legend.margin = margin(r = 7, unit = "mm")
  )
)
doc_theme <- theme_ggchord_publication(
  axis.text = element_text(size = 11),
  axis.text.check.overlap = TRUE
) +
  theme(
    legend.position = "bottom",
    legend.title = element_text(size = 13, face = "bold"),
    legend.text = element_text(size = 11),
    legend.key.width = unit(9, "mm"), legend.key.height = unit(5, "mm"),
    legend.spacing.x = unit(9, "mm"), legend.spacing.y = unit(7, "mm"),
    legend.box.spacing = unit(6, "mm"),
    plot.background = element_rect(fill = doc_background, colour = NA),
    panel.background = element_blank(),
    plot.title = element_text(face = "bold", size = 18),
    plot.subtitle = element_text(size = 10, colour = "#5C625A"),
    plot.margin = margin(14, 18, 14, 18)
  )
doc_axis <- function(coordinates = "relative") {
  scale_seq_position_continuous(
    coordinates = coordinates, n.breaks = 3, minor_breaks = NULL,
    labels = function(x) format(x, scientific = FALSE, big.mark = ",", trim = TRUE)
  )
}

library(dplyr)
data(plasmid_example_pUC19)
plasmid_seq <- plasmid_example_pUC19 |>
  select(accver, length)
feature_source <- find_common_features(plasmid_example_pUC19)
features <- feature_source |>
  select(accver, start, end, strand, type, anno)
Run the preparation above once. Each object below is a normal composable ggplot; print it or use ggsave().
Chord: compare multiple sequences
Code
p_chord <- ggchord(seq_data = seqs, ribbon_data = links, gene_data = genes) +
  geom_link_ribbon(aes(ribbon_fill = qaccver), alpha = .7) +
  scale_ribbon_fill_manual(values = seq_palette, guide = "none") +
  geom_seq(show.legend = FALSE) +
  geom_gene(position = position_strand(.1), width = .04) +
  geom_seq_label(size = 4, seq_label_radius = .84, seq_label_hjust = .5) +
  coord_chord() +
  scale_seq_colour_manual(values = seq_palette) +
  scale_gene_fill_manual(values = gene_palette) +
  doc_theme
p_chord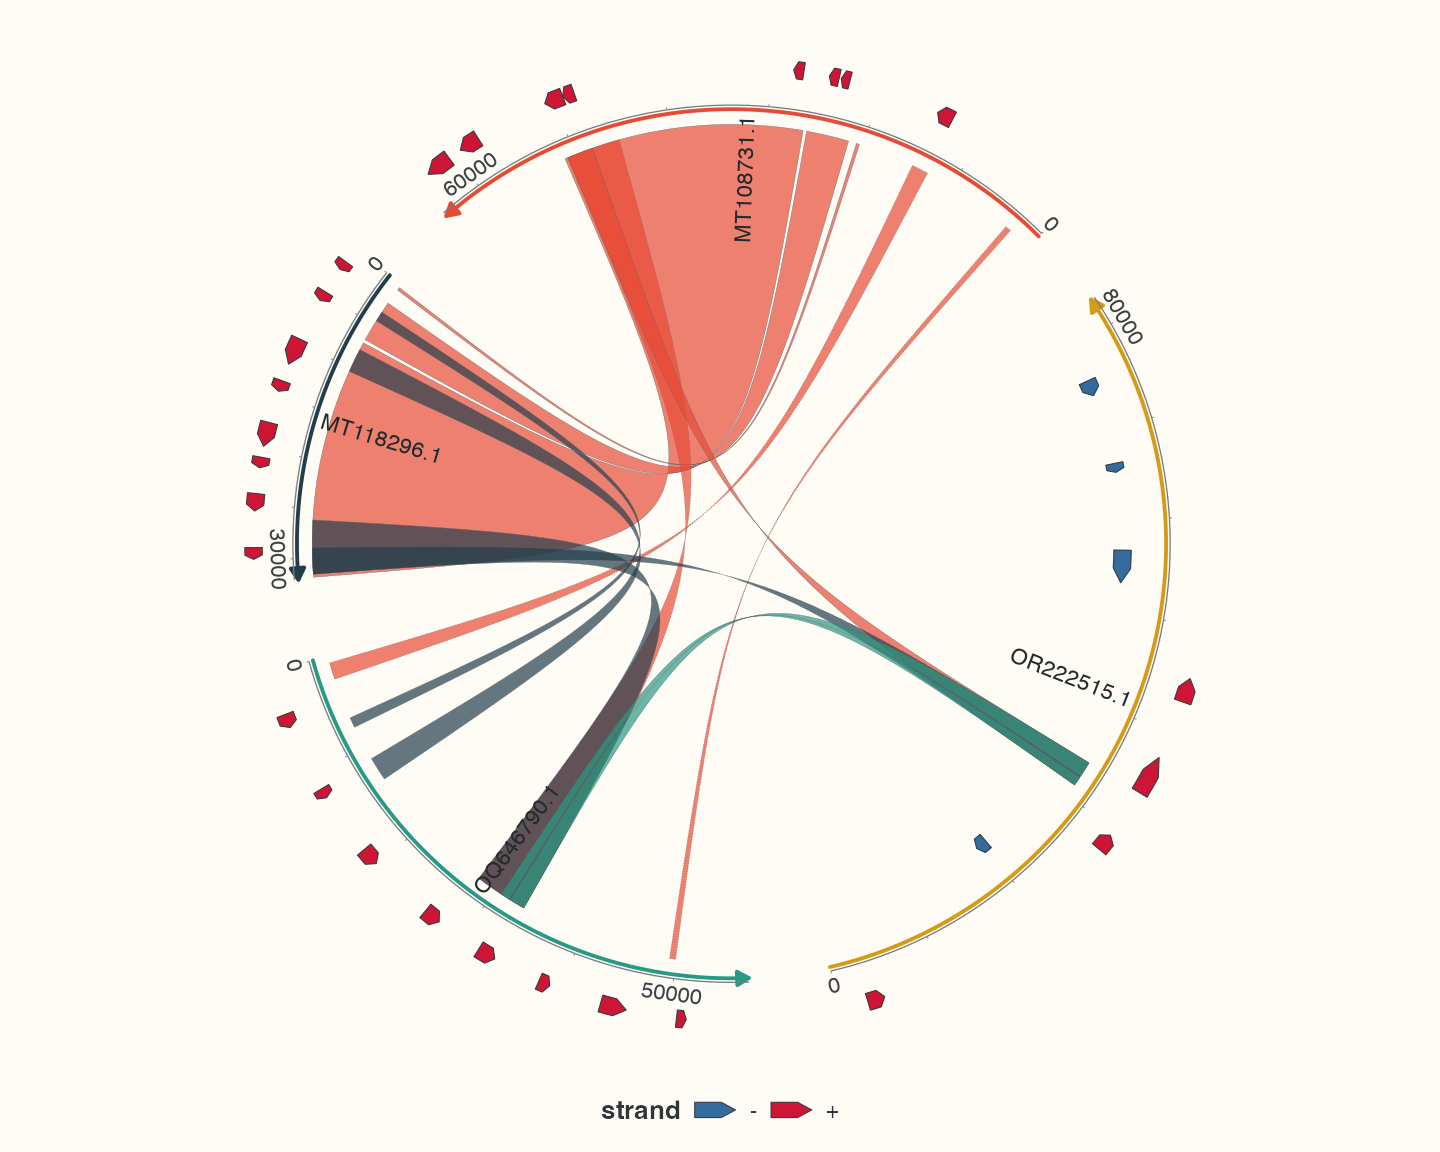
Links are coloured by query sequence ID using the backbone category palette; this does not encode identity or homolog groups. See the raw-record workflow for colour mapped to reported identity. coord_chord() controls global rotation and fitting. Sequence-local radius, curvature, gap and orientation belong to geom_seq(). A NULL link control point uses the historical origin-based chord route; it does not mean a universal straight link. Ribbon avoidance defaults to uniform, line avoidance to none.
Collinear: align local comparisons
Code
anchors <- genes |>
  group_by(accver) |>
  slice_max(end - start, n = 1, with_ties = FALSE) |>
  ungroup() |>
  select(accver, start, end)
p_collinear <- ggchord(seq_data = seqs, ribbon_data = links, gene_data = genes) +
  geom_link_ribbon(aes(ribbon_fill = qaccver), alpha = .7) +
  scale_ribbon_fill_manual(values = seq_palette, guide = "none") +
  geom_seq() +
  geom_gene(position = position_strand(.1)) +
  geom_seq_label(size = 4) +
  coord_collinear(anchor = anchors, align = "center", orientation = "auto") +
  doc_axis() +
  scale_seq_colour_manual(values = seq_palette) +
  scale_gene_fill_manual(values = gene_palette) +
  doc_theme
p_collinear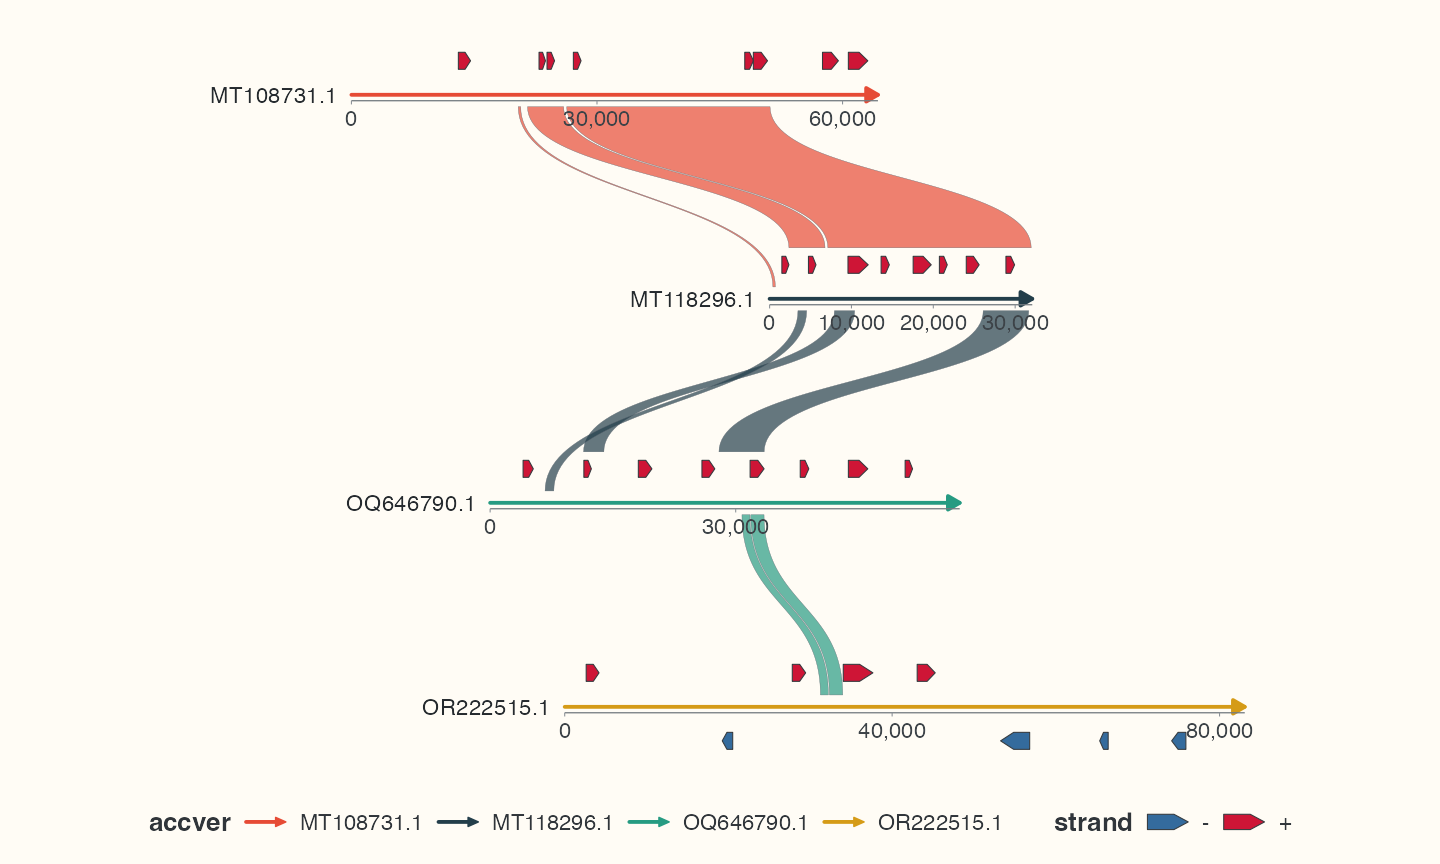
Each sequence is anchored to its own longest known gene for display; this does not assert homology. anchor aligns specified intervals; orientation = "auto" chooses supported orientations using available evidence. Inspect orientation diagnostics rather than assuming biological inversion. Ribbons connect adjacent displayed rows by default; use adjacent_only = FALSE or explicit pairs to retain others. Non-adjacent outlines default to dashed; explicit styles take priority. These rules differ from chord mode. Focus and segments preserve source coordinates for cropped or locally reversed views.
Circular: annotate one sequence
Code
circle_features <- features |>
  filter(type %in% c("CDS", "rep_origin"))
p_circular <- ggchord(seq_data = plasmid_seq) +
  geom_seq() +
  geom_feature(aes(feature_fill = type), data = circle_features, position = position_plasmid()) +
  geom_feature_label_repel(data = circle_features, position = position_plasmid(), size = 4) +
  geom_seq_center_label() +
  scale_feature_fill_manual(values = feature_palette, breaks = unique(circle_features$type)) +
  coord_circular() +
  doc_theme
p_circular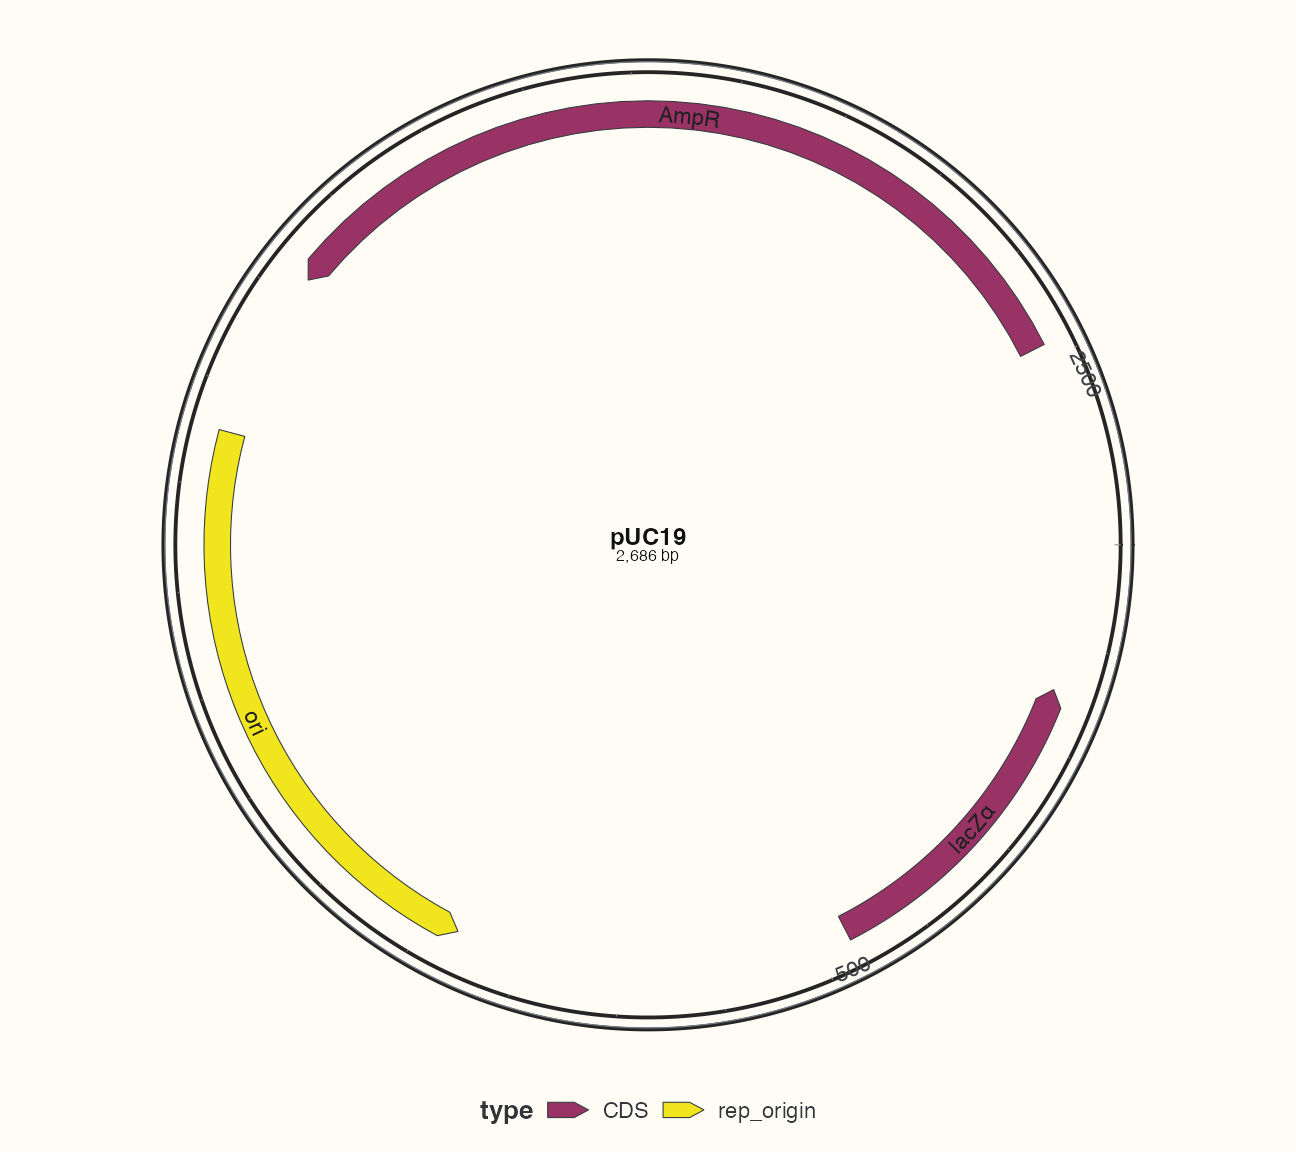
This example selects CDS and the replication origin for display, retaining the full sequence bp axis. coord_circular() requires a single sequence. General features can carry unknown strand. geom_feature_plasmid() is a convenience preset with its own defaults; choose it explicitly when those defaults fit the task. Primer and restriction layers are described in recognition.
Check your result
First count sequences: use circular for one annotated sequence, chord for the overall link pattern, and collinear for positions, distances or neighbourhoods.