Site guide · find your task
ggchord
On this page

GENOMIC VISUALIZATION · R / GGPLOT2
Reveal the structure. Follow the connections.
Compose chord comparisons, collinear views and dense plasmid maps. Build reproducible genomic figures from real sequences, alignments and annotations.
Choose your visualization
Chord · Four genomes, one connected view
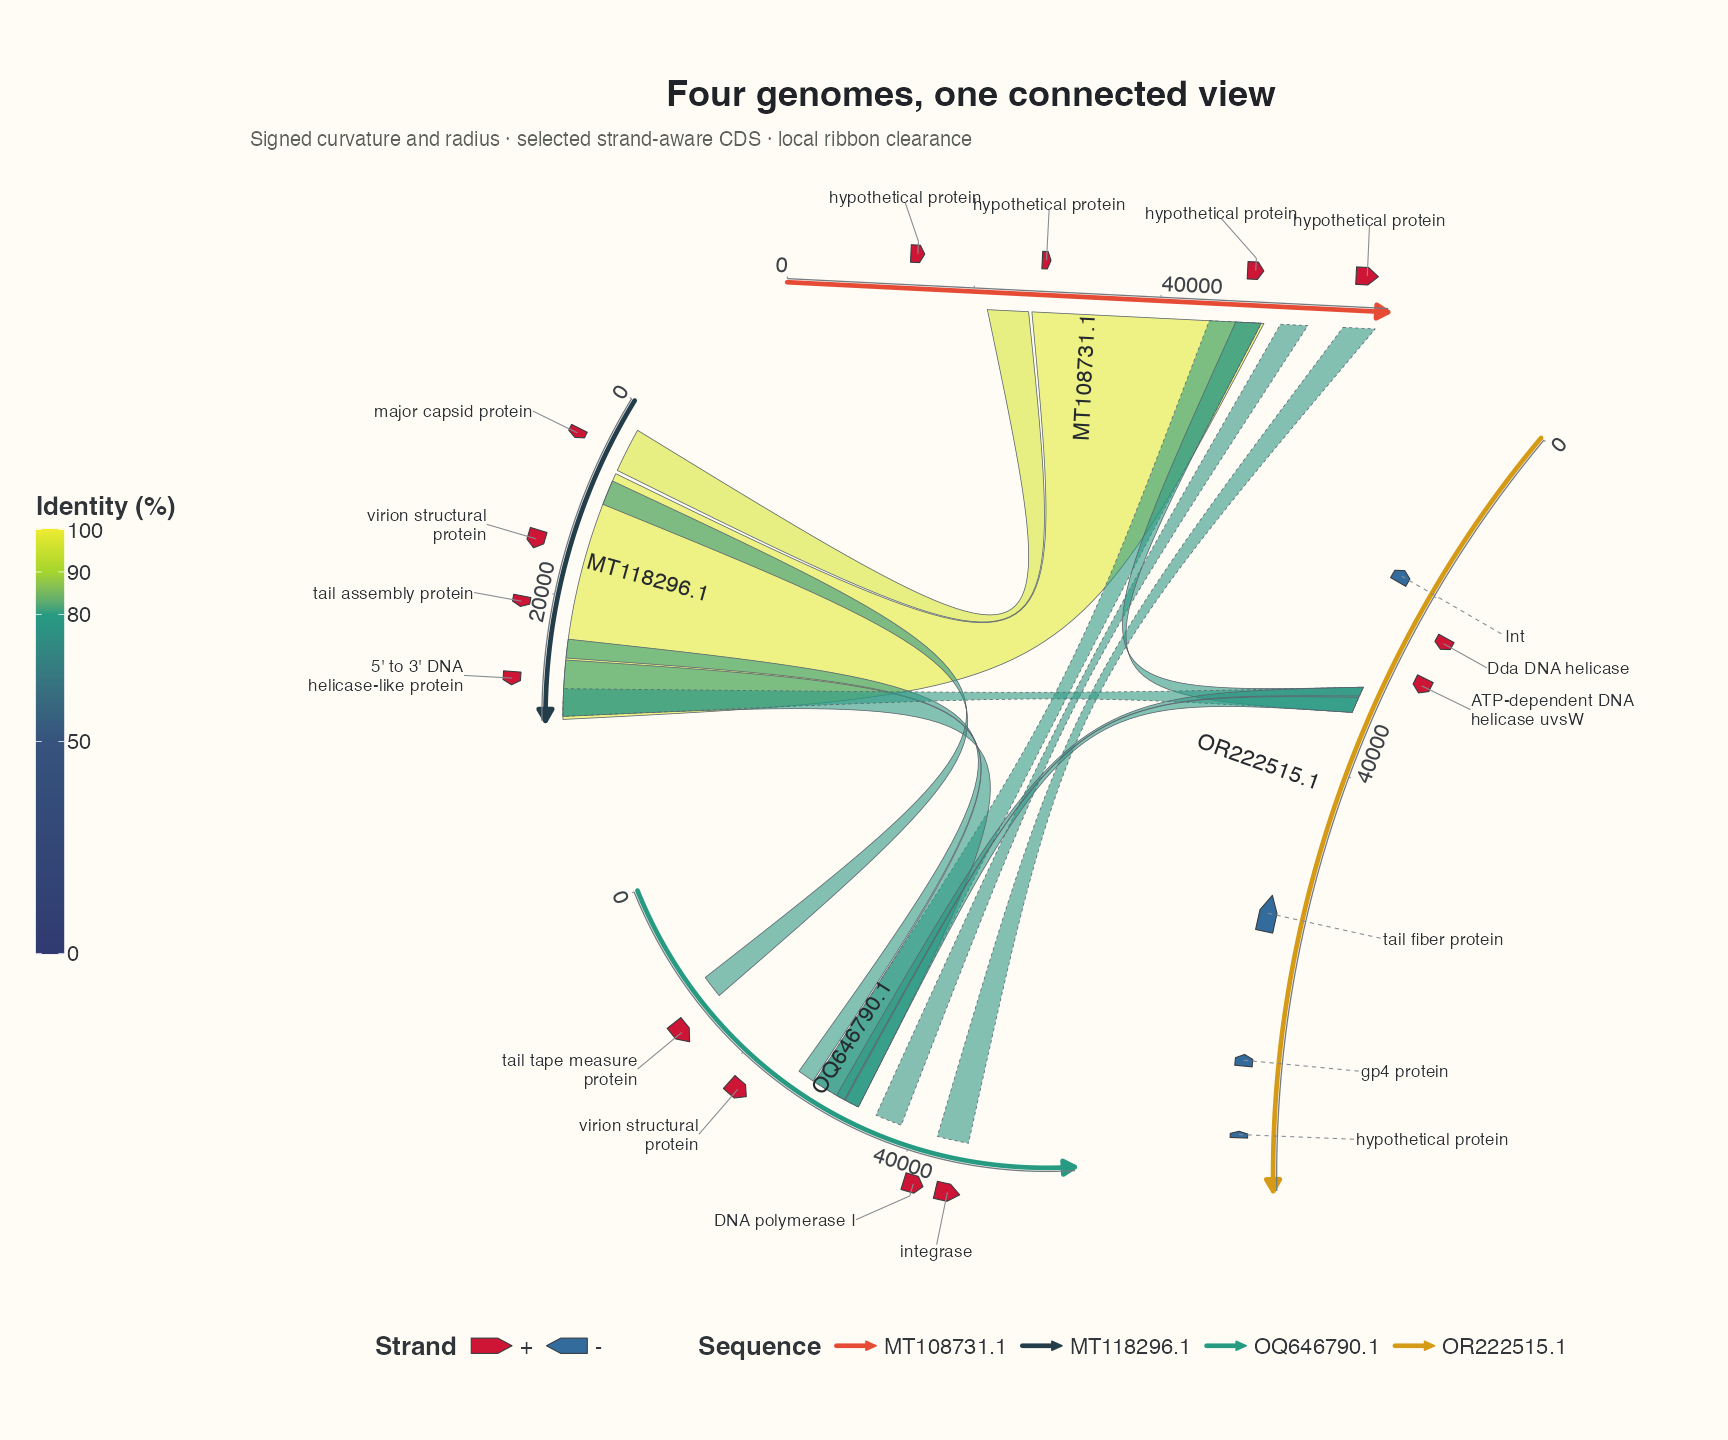
The original ggchord view, refined with signed curvature, varying radii, optimized display direction, local ribbon clearance and individually labelled selected features from real records. Data, complete code and interpretation →
Collinear · Four rows, many layers
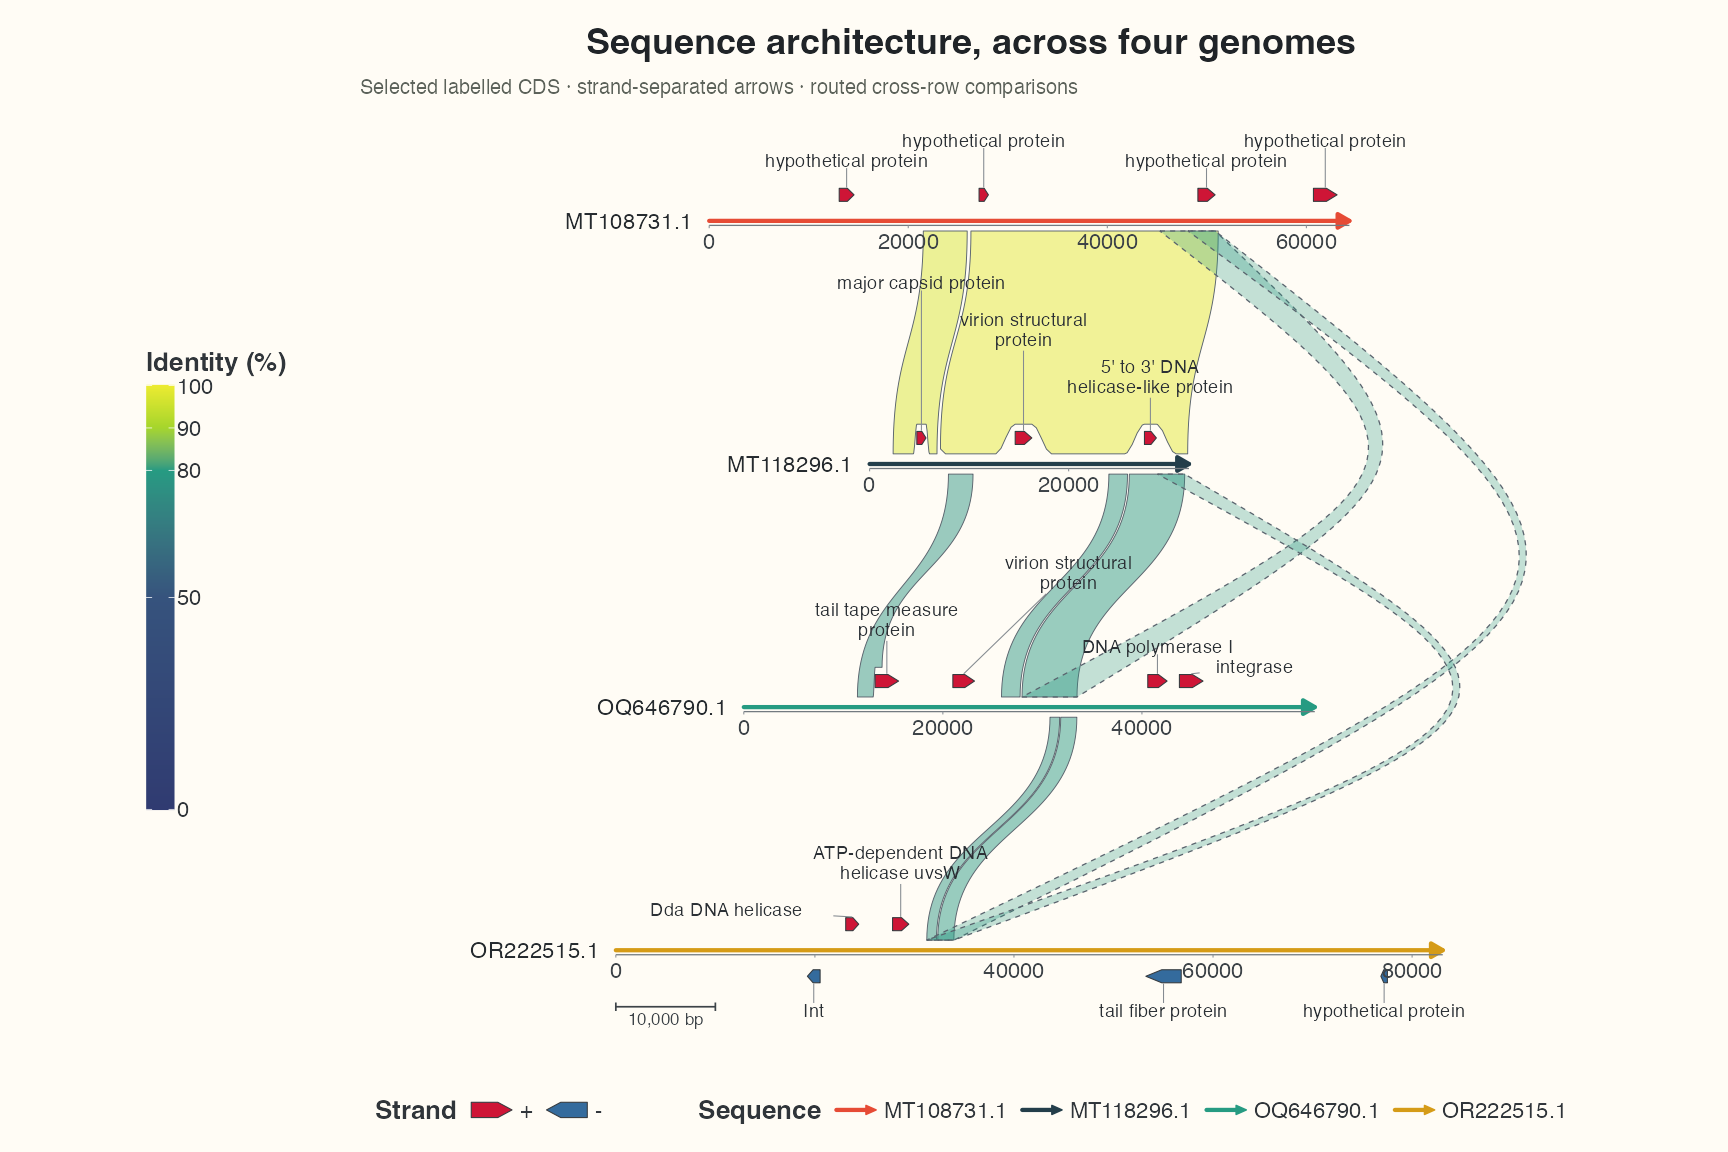
A linear expression of the chord grammar, reusing real sequences, observed alignments and the identity palette. Features separate by strand; long cross-row links route to the right. The tutorial demonstrates coordinate-only conversion and explains current circular-only parameter limits. Complete workflow and the meaning of each layer →
Plasmid · A richly annotated pETDuet-1
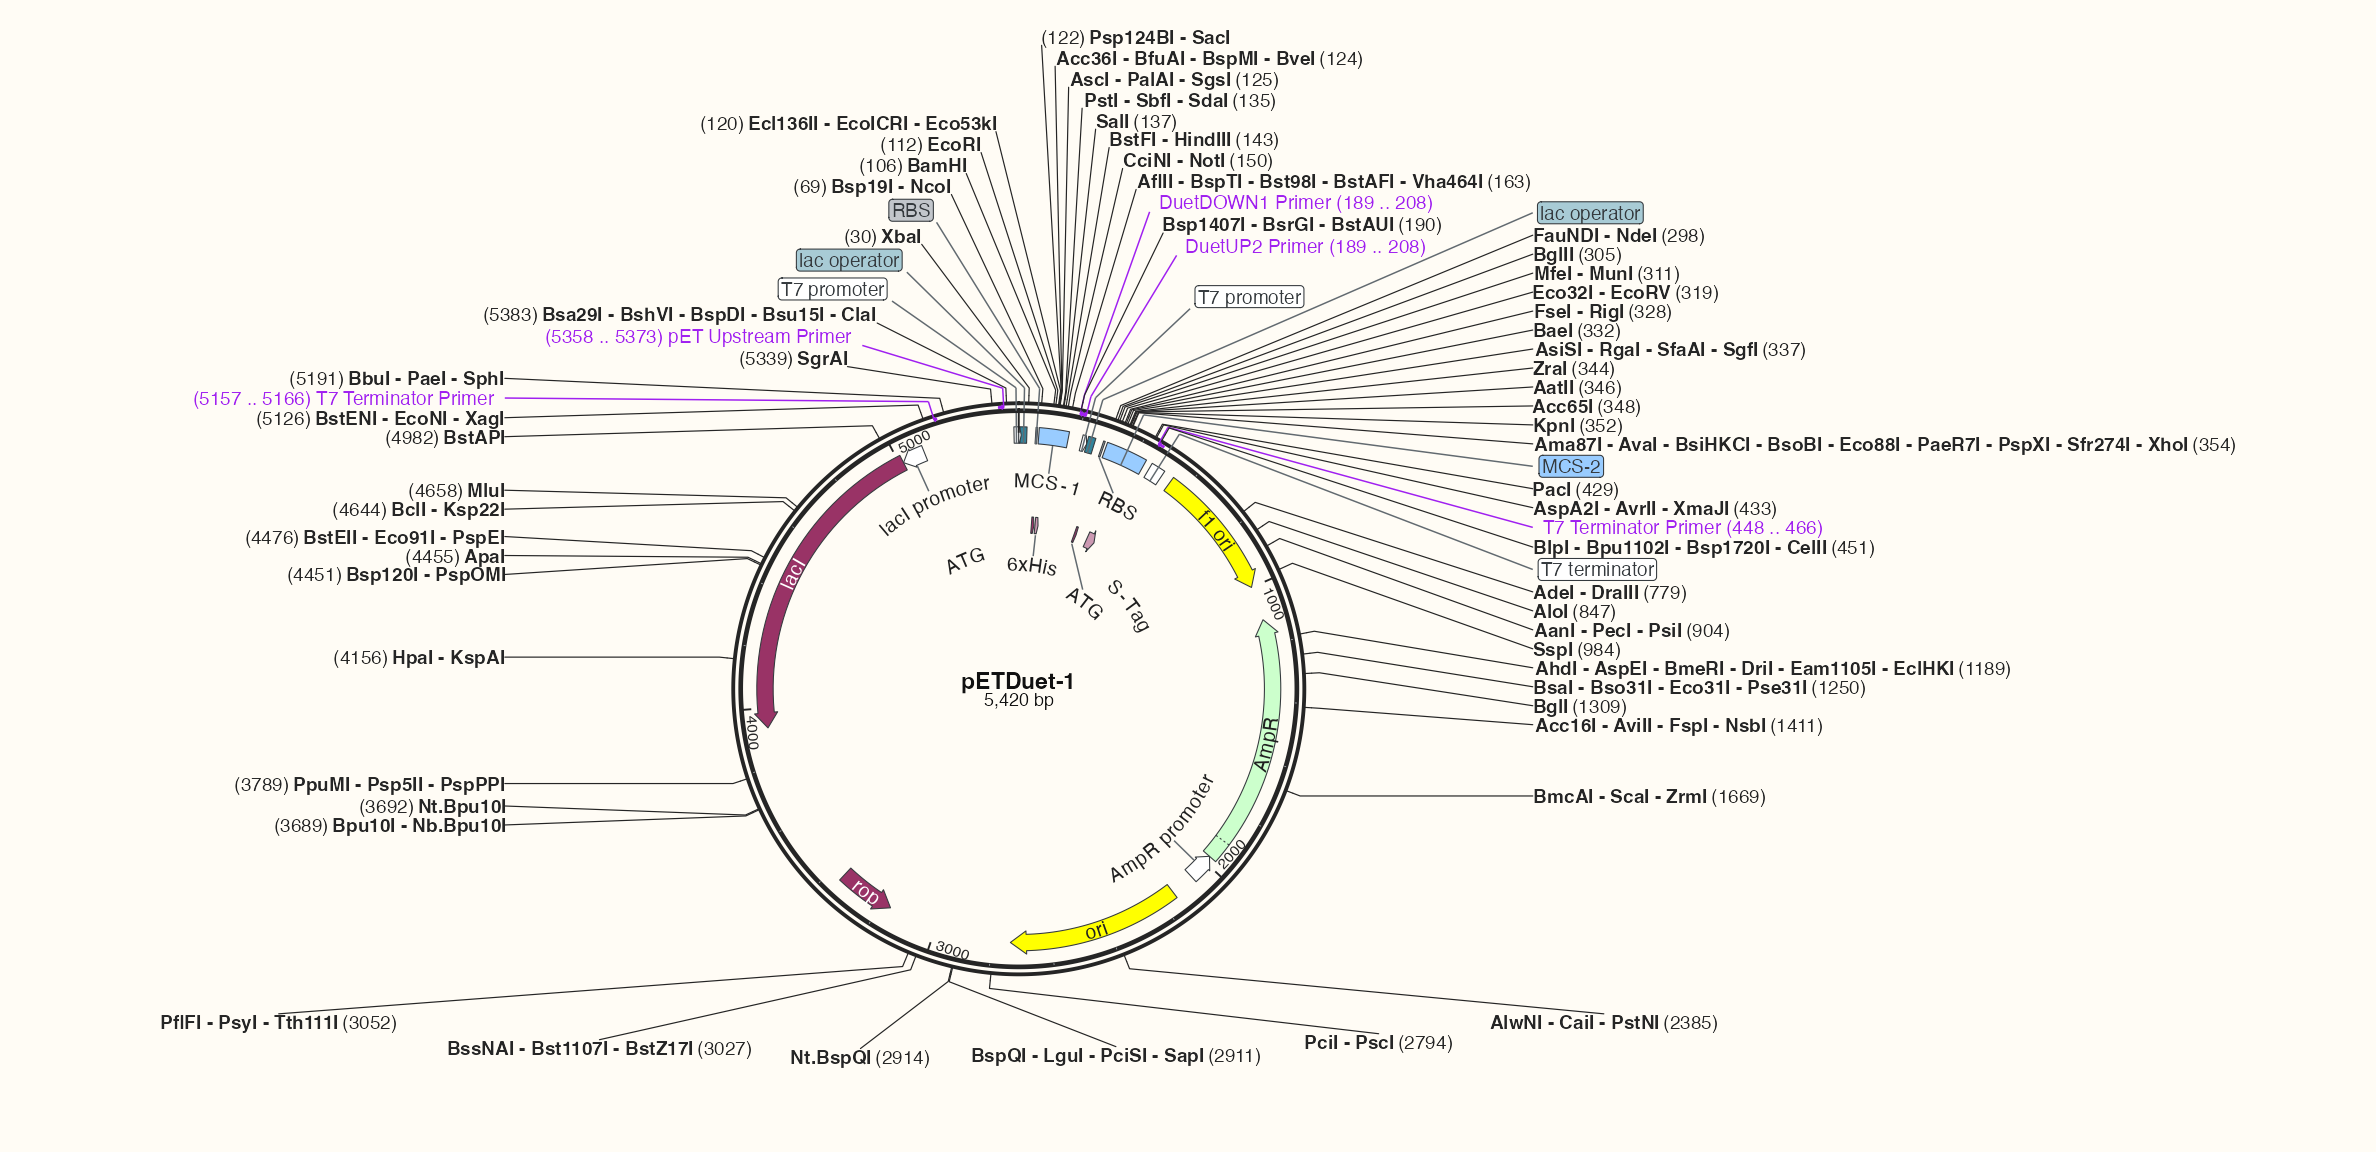
A double backbone, layered features, five reference primers and restriction-enzyme names grouped by shared cut position. The input includes 58 cut positions and 20 features; labels are laid out for the actual export size. From a first circular view to complete plasmid annotation →
Continue from where you are
- Install and draw a first plot
- Import your own data
- Adjust colours, legends and themes
- Browse all workflows and capabilities
- Look up functions, arguments and results
Examples prefer dplyr, purrr, tidyr and the native |> pipe, with ggplot2 layer composition. Updating older code? Read themigration guide.