Chapters and reference
Complete canonical API text; task articles explain the workflows. Usage guide

Register an independent character plot for genomic composition
Source:R/alignment-panel.R
register_ggchord_alignment.RdAttaches an explicit source/column map to an ordinary Cartesian ggplot. It remains editable and independently printable. Fusion and magnify rebuild the plot at its final physical size, check registered cells against actual geom_residue positions/labels, and project exact source boundaries. No HSP interpolation or implicit alignment is performed.
Arguments
- plot
A single-panel Cartesian ggplot with geom_residue layers mapping x = alignment_column, y = accver, label = symbol. Identity/reverse x scales and a discrete y scale are supported. Additional independent annotations are allowed. Facets, nonlinear scales, flipped coordinates and position adjustments moving registered cells are rejected. geom_residue(line_width = ...) is supported. Each selected source interval must lie within one displayed line; split cross-line selections explicitly.
- data
The displayed rows of
as_ggchord_alignment(),read_aligned_fasta()or translate_ggchord_cds()$nucleotides/residues. One cell per accver/alignment_column; source coordinates must be unique within each row. Keep original columns when filtering a window. Every selected source base must be present; split spliced regions explicitly. Origin-wrapping magnify regions require explicit circular source metadata. Gap columns remain visible but have no source coordinate.
Value
The ordinary plot with a source registration. Use it as detail_plot
in magnify_ggchord() or as an outer fusion_panel(). Region detail_instance
selects an exact alignment row accver when several rows share a source.
Registrations assert supplied provenance; source_verified is not an
independent biological validation. Exported source layouts retain data.
Examples
R · Example code
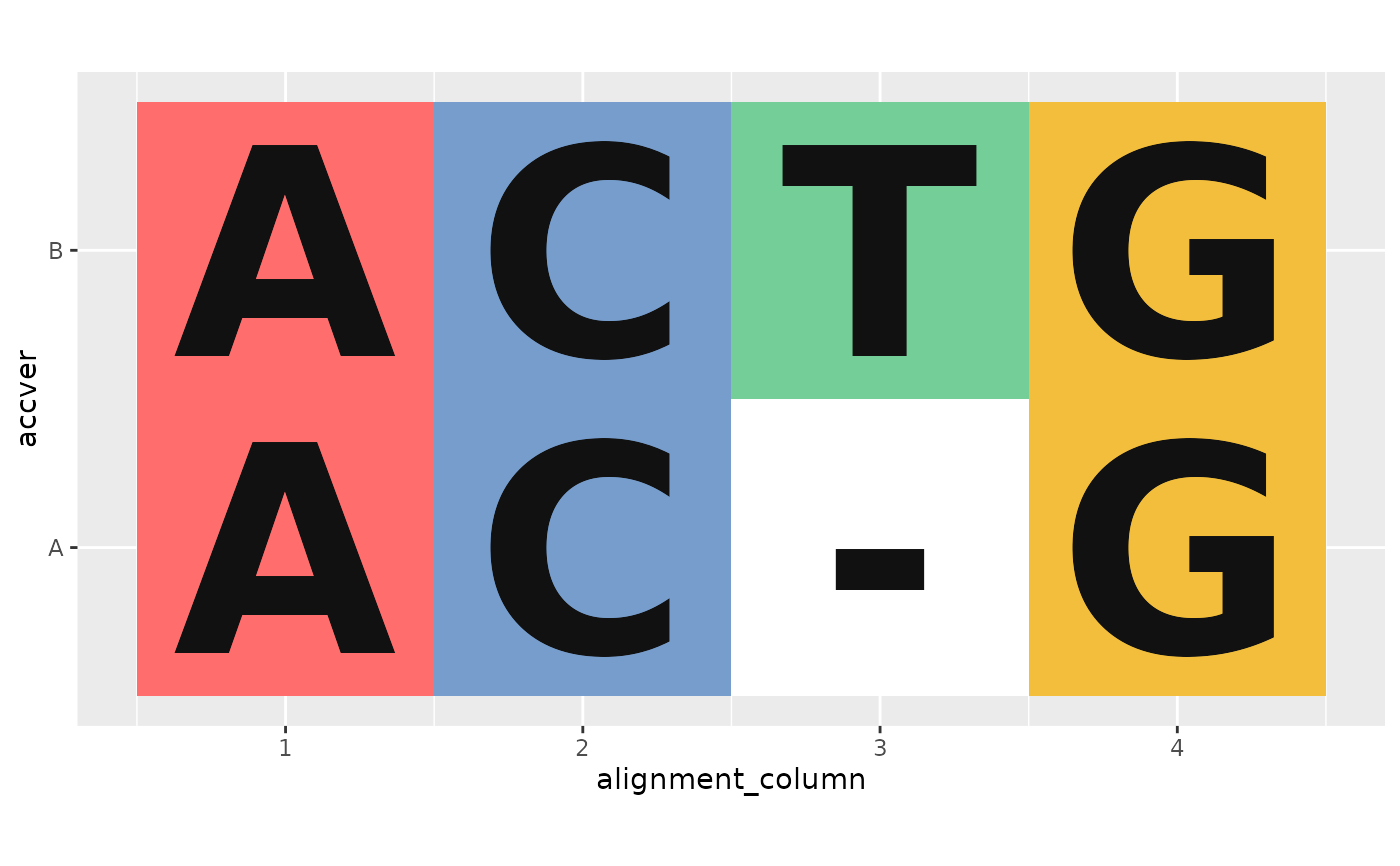
# Explicit synthetic format example.
cells <- as_ggchord_alignment(c(A = "AC-G", B = "ACTG"), "DNA")
p <- ggplot2::ggplot(cells, aes(alignment_column, accver, label = symbol)) +
  geom_residue(aes(fill = symbol), show.legend = FALSE)
register_ggchord_alignment(p, cells)