Chapters and reference
Plotting modules · Section 1 of 2
Module III · Sequence alignment Dotplot
On this page
HSP relationships on two sequence axes
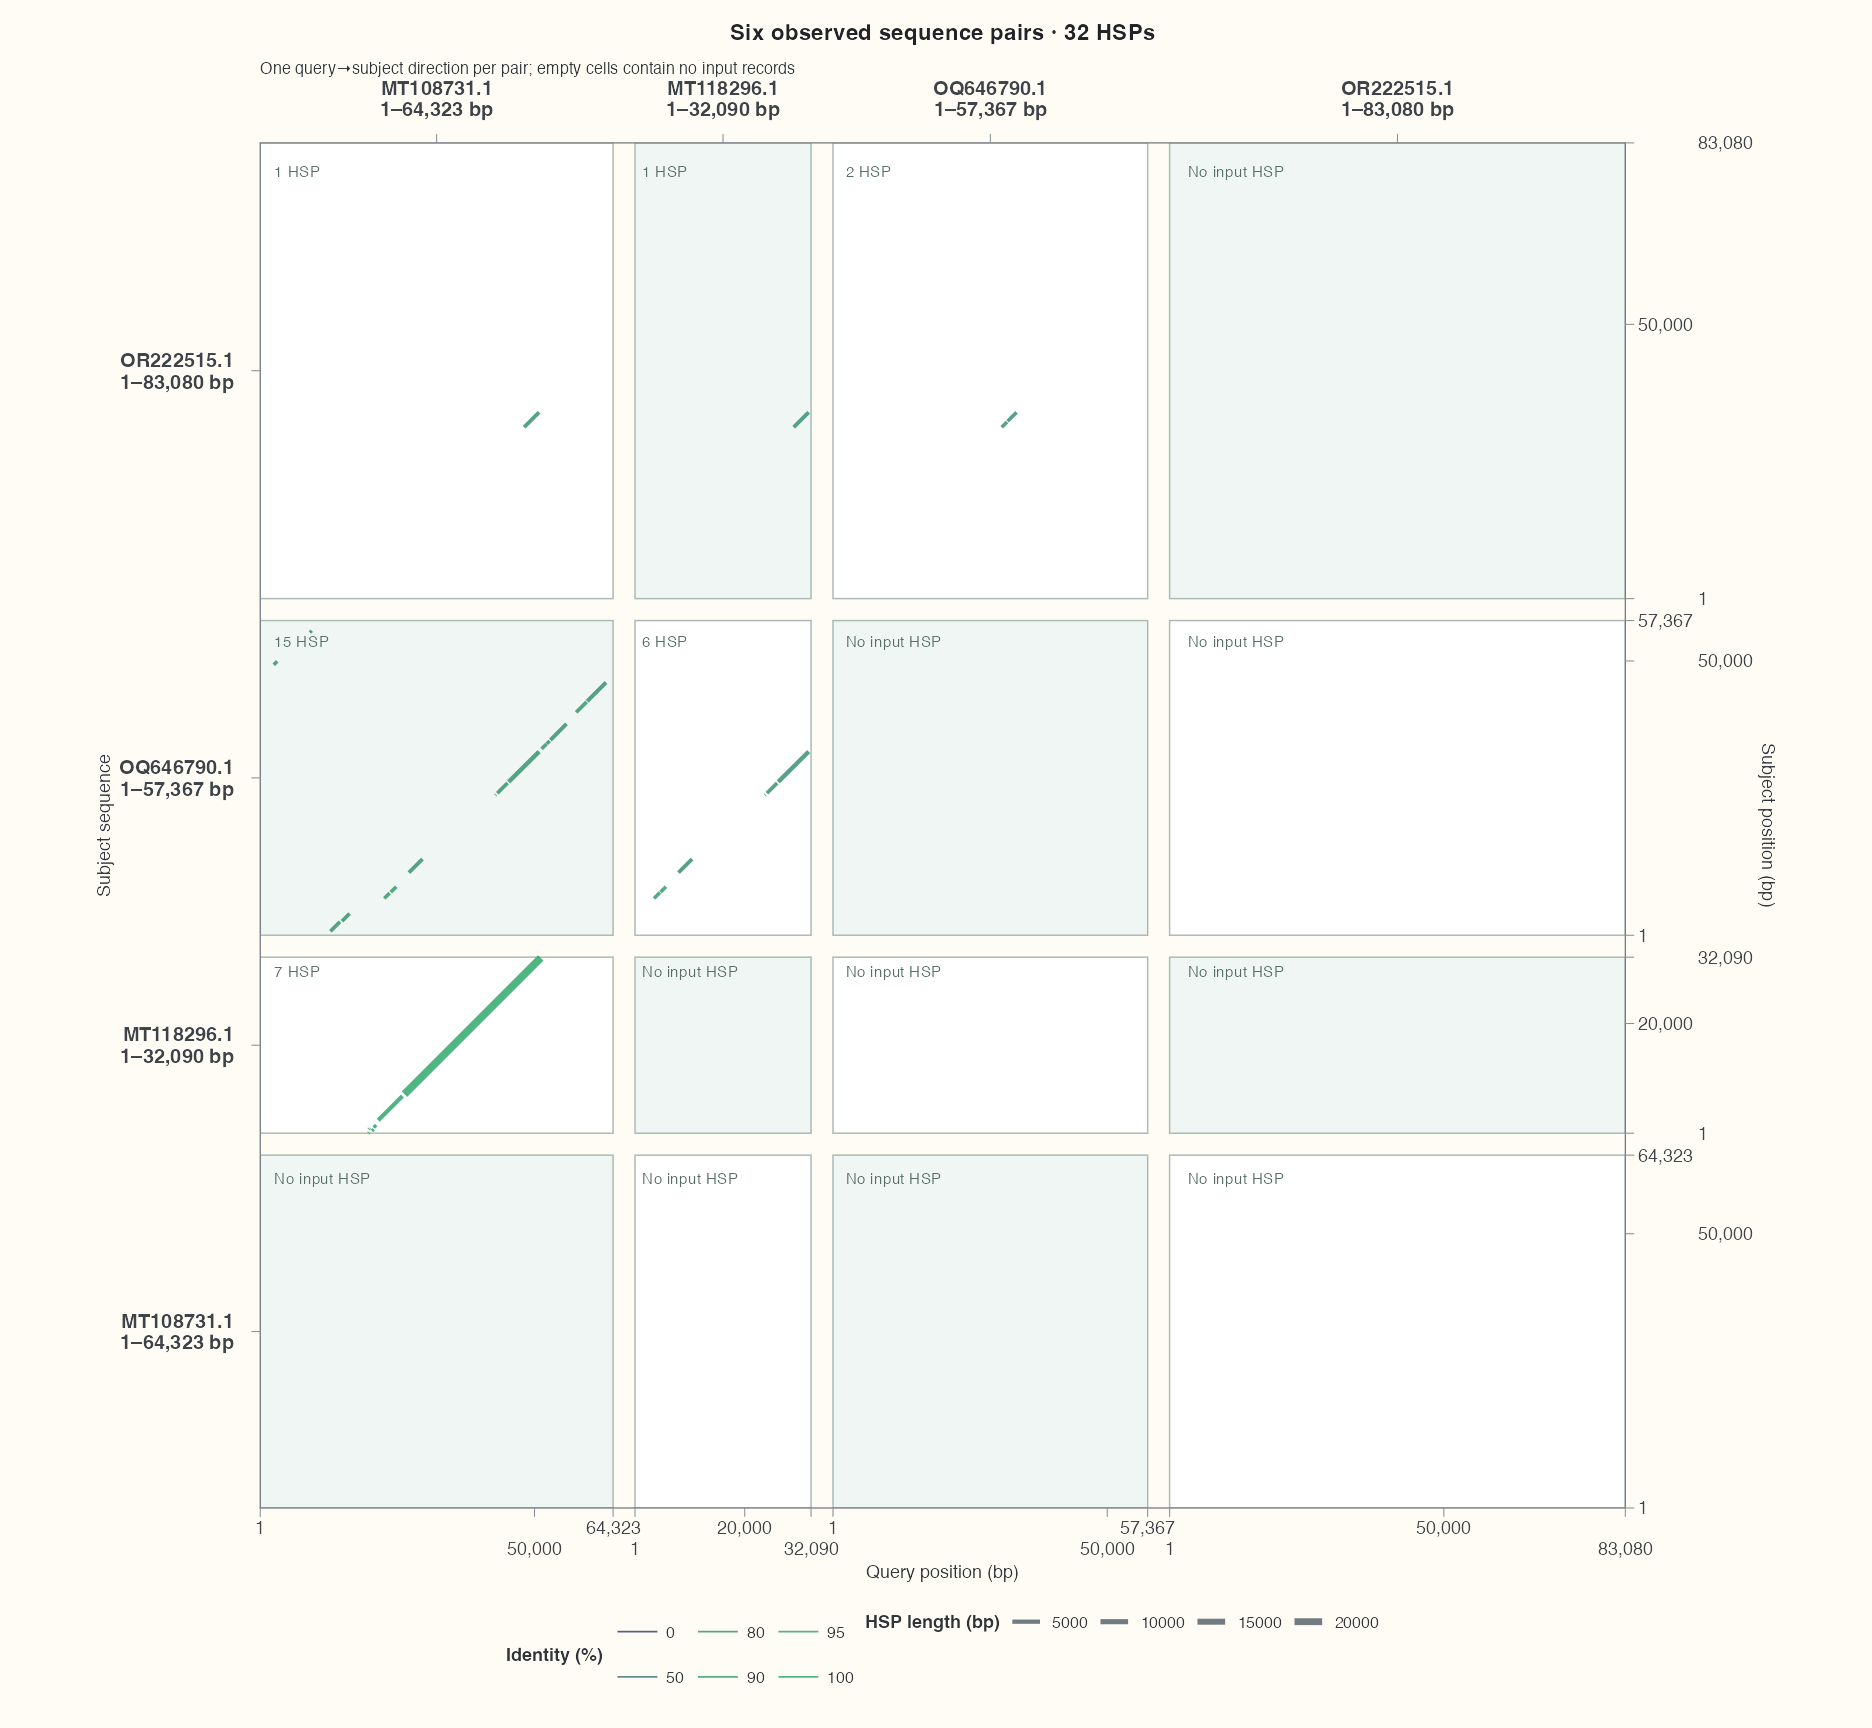
This matrix uses all 32 original HSP records across four complete sequence inputs. Both axes preserve accession identity and local positions. Identity controls colour; observed HSP length controls stroke width.
To read the matrix, choose a query sequence at the top and a subject sequence on the left. Their outlined intersection is the comparison region for that pair. Headers show complete ranges; bottom and right ticks use local positions. Cell sizes retain sequence-length proportions, and an empty region means only that the input contains no HSP there.
What the module supports
- Multiple query and subject sequences, explicit axis order and native-unit gaps.
- Forward and reverse HSP endpoints, independent display orientation on either axis.
- Identity and other supplied metrics mapped through link scales.
- Exact source-to-display conversion, visible windows and traceable input rows.
Data, axes and mapping · Alignment imports · Protein coordinates
Required inputs
Supply complete lengths and query/subject IDs, plus qstart/qend/sstart/send for each HSP. Axis concatenation does not fuse biological sequence identities. bp and aa need separate coordinate domains or an explicit projection.
Boundaries
Each mark is an HSP endpoint segment, not a base-by-base reconstruction. Mismatches and gaps need observed aligned characters or an exact alignment trace. Backbone gene/feature/track layers do not apply here. Dotplot is not a registered Fusion endpoint.