Chapters and reference
Complete canonical API text; task articles explain the workflows. Usage guide

A standard Cartesian ggplot layer for local nucleotide/protein excerpts.
Map x to alignment columns (or independently known source positions), y
to sequence rows and label to actual characters. It does not compute an
alignment or project through ggchord's biological backbone coordinates.
Use register_ggchord_alignment() to associate exact source positions with
a Fusion/magnify detail panel. Half-cell extents train position scales so
first/last cells remain fully visible by default.
Native scales must be identity or reverse; nonlinear scales and non-Cartesian
coordinates are rejected rather than misrepresenting single-position cells.
Usage
R · Example code
geom_residue(
  mapping = NULL,
  data = NULL,
  overflow = c("tile", "error"),
  position = "identity",
  show.legend = FALSE,
  inherit.aes = TRUE,
  line_width = NULL,
  ...
)
Arguments
- mapping, data
Standard ggplot2 layer mapping and data. Required aesthetics are x, y and label. Ordinary colour, fill, alpha, size, family and fontface mappings/scales are supported. Explicit
sizeis in mm; omitted size fits cells uniformly with a 3 mm readability floor.- overflow
"tile"(default) or"error"when letters do not fit.- position, show.legend, inherit.aes
Standard ggplot2 layer arguments.
- line_width
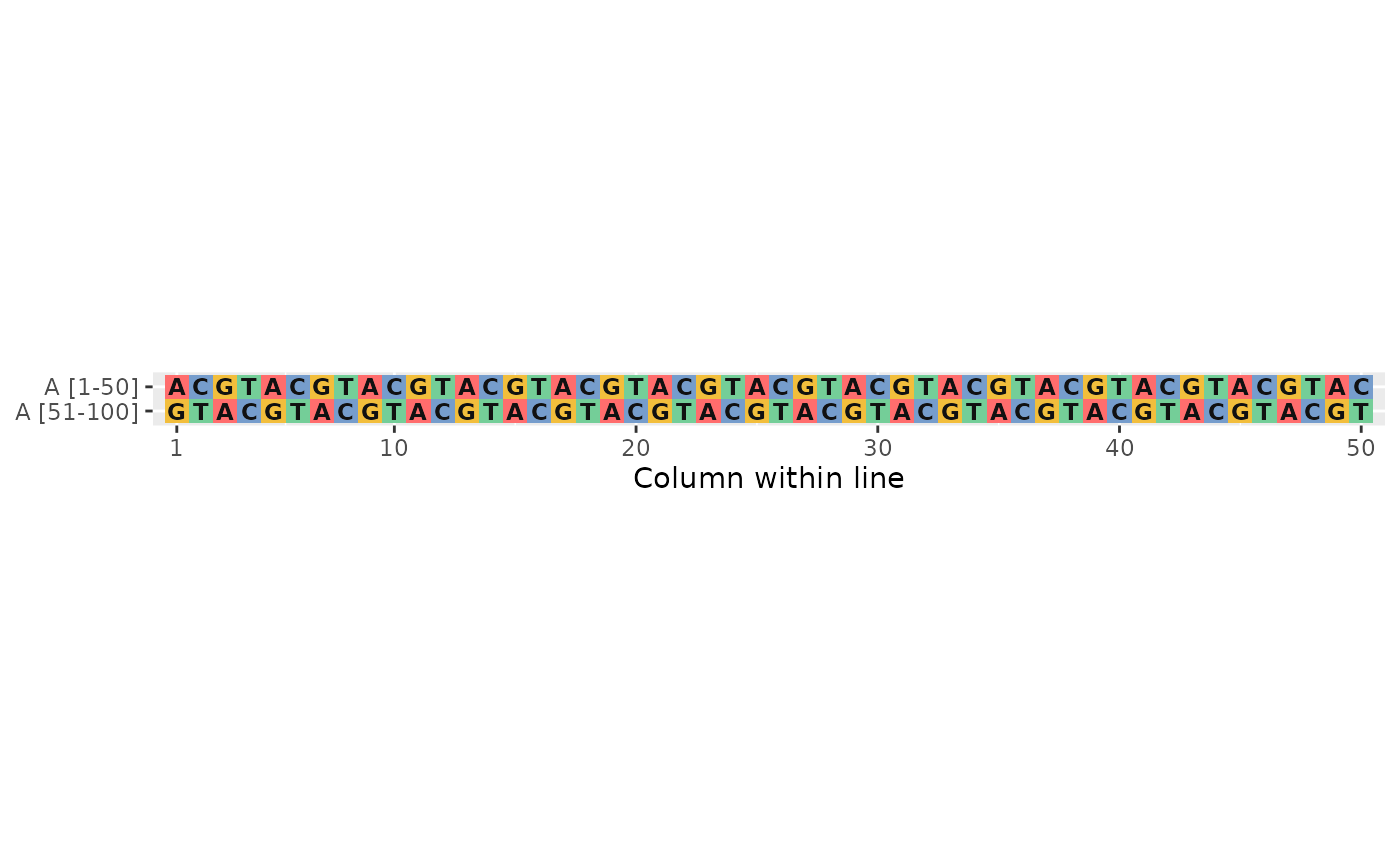
Optional positive integer number of columns per displayed line. NULL (default) keeps one line. Lines start at the smallest displayed x value; gaps occupy columns. Multiple sequences share the same breaks. Row labels show the original column range; the x axis counts within a line. Wrapping changes display only, preserving original input/source coordinates. Registered Fusion selections must fit one displayed line; split a selection crossing lines into explicit source intervals.
- ...
Fixed text/cell aesthetics and na.rm, passed to the layer.
Value
A standard ggplot2 layer. Cells span one x unit and one y unit. Use discrete y rows or unit-spaced rows.
Details
At drawing time, each cell's final physical width/height is compared with
its actual glyph metrics. overflow = "tile" omits letters that cannot fit
and retains their mapped fill cells; "error" requires readable letters.
Explicit font sizes are never silently reduced. The decision is remade at every target
size, including standard ggsave; DPI alone does not supply physical space.
Cells meet at their edges to form a continuous alignment matrix. When the
plot still uses its default Cartesian coordinate system, the layer supplies
a fixed 1:1 aspect ratio so rows remain as compact as alignment columns.
Explicit coordinates take priority. Without a size mapping or fixed size,
characters grow uniformly to fit their cells, with a 3 mm readability floor;
smaller cells use the same overflow policy rather than shrinking the text.
When fill is not supplied, label is mapped to fill. A chemistry scale is
inferred from the data's explicit alphabet column (DNA/RNA/AA; otherwise AA).
Existing user fill mappings, fixed fills and scales take priority.
See scale_fill_residue() for explicit alphabet and palette control.
Examples
R · Example code
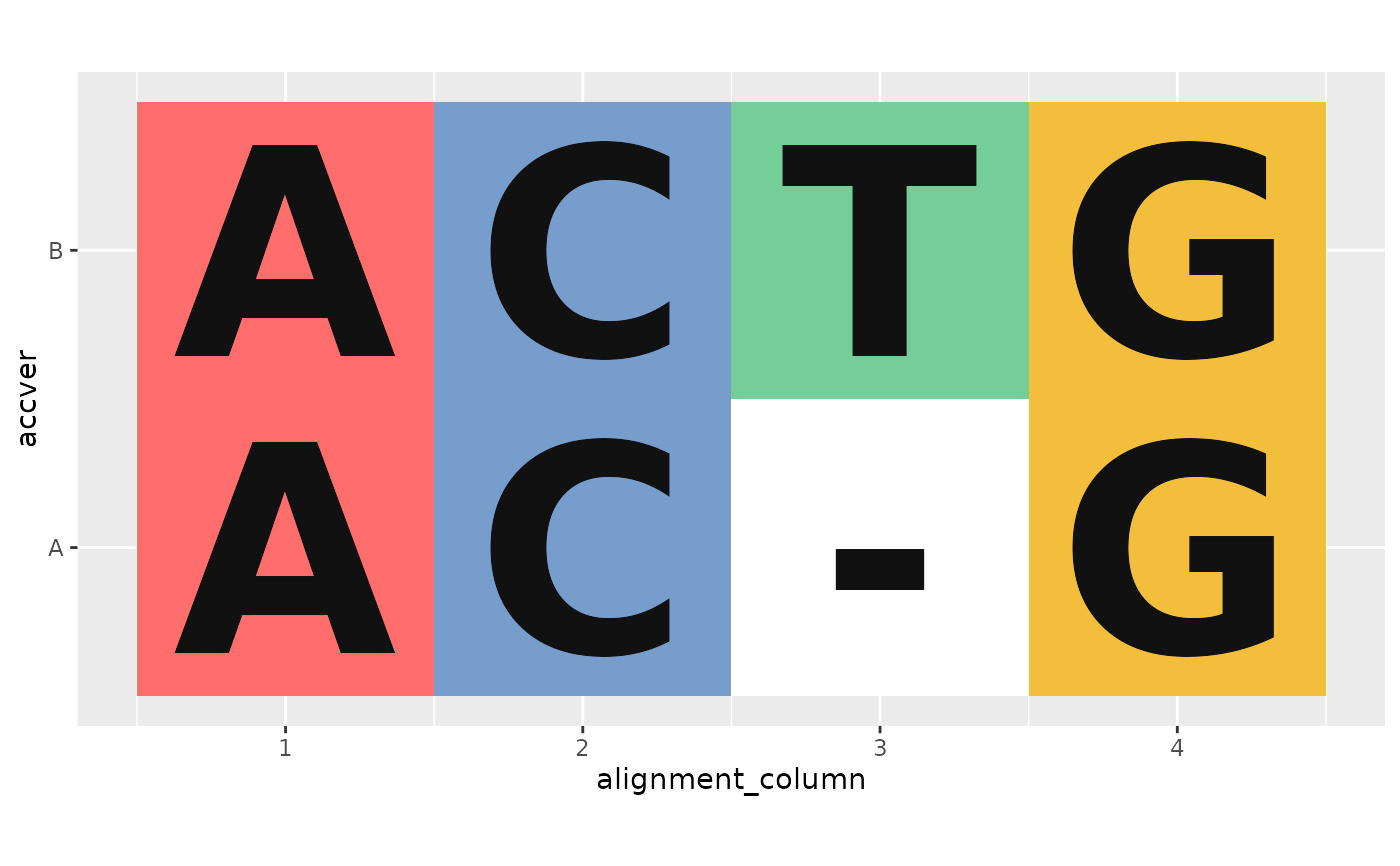
# Explicit synthetic format example; real-data workflow is in the tutorial.
cells <- as_ggchord_alignment(c(A = "AC-G", B = "ACTG"), "DNA")
ggplot2::ggplot(cells, aes(alignment_column, accver, label = symbol)) +
geom_residue(aes(fill = symbol))
 long <- as_ggchord_alignment(c(A = strrep("ACGT", 25)), "DNA")
ggplot2::ggplot(long, aes(alignment_column, accver, label = symbol)) +
geom_residue(line_width = 50)