Chapters and reference
Complete canonical API text; task articles explain the workflows. Usage guide
Marks real source intervals in registered genomic panels and connects them to the same intervals in independent genomic or registered character details. A detail or source can itself be a nested Fusion. Returns a Fusion, not a new Coord or a crop of an existing image. Ordinary ggsave rebuilds both panels, highlights and leaders at the actual target size.
Usage
R · Example code
magnify_ggchord(
  plot,
  region,
  detail_plot,
  side = c("right", "top", "left", "bottom"),
  center_size = NULL,
  detail_size = NULL,
  connector = c("leader", "none", "envelope"),
  colour = "#B45309",
  alpha = 0.2,
  highlight_width = 1.5,
  linewidth = 0.35,
  linetype = 2,
  detail_box = NULL,
  allow_overlap = FALSE,
  center_box = NULL,
  route = c("direct", "avoid"),
  guides = c("keep", "collect"),
  frame_region = NULL
)
Arguments
- plot
A registered ggchord genomic source plot or nested Fusion.
- region
Nonempty data frame with
accver,start,endin original one-based inclusive source coordinates. Bounds must be ordered positive integers. Optionalinstanceanddetail_instanceselect exact display instances in the source and detail panels for every row. Ambiguity fails. Explicit wrap = TRUE permits start > end across a circular source origin. Both selected leaves must declare matching full source lengths; character sources require as_ggchord_alignment(circular = TRUE). The interval is drawn as two pieces with only its two external boundary leaders. With a list of details, adetail_panelcolumn selects the named target for each row. Nested leaves use full paths, for example detail/center; optional source_panel similarly selects a source leaf under center. Ambiguous container selection fails.- detail_plot
An explicit registered ggchord genomic plot, nested Fusion, a character plot from
register_ggchord_alignment(), or a uniquely named list of such plots. Every panel must have at least one source region; the namecenteris reserved. The selected source interval must be fully visible in both panels, in the same bp/aa unit. Character plots require explicit source/column registration; ordinary unregistered plots are rejected.- side
A named side from fusion_panel(), including diagonal sides. For a list of plots, supply a character vector named by panel ID, with distinct fixed sides or repeated auto values for automatic perimeter allocation. Every input region still explicitly selects its detail panel.
- center_size, detail_size
Optional panel width/height fractions, following
ggchord_fusion()andfusion_panel(). Defaults reserve a smaller source panel and a wider detail container for a single detail plot. With multiple details, use a named list of sizes or NULL for Fusion defaults; center_size also follows Fusion defaults. Out-of-frame allocations fail; overlap requires explicit allow_overlap.- connector
"leader"draws two decorative boundary leaders per row;"none"retains the highlights only."envelope"groups selections by source/detail panel pair, outlines each exact source highlight band and frames the displayed detail sequences with their native labels (excluding plot titles and guides). Two leaders join actual source-band edges to the detail frame. Source selections are never enclosed in a padded combined rectangle. The detail frame is a display boundary, not a genomic interval. These are not biological ribbons or alignments.- colour
Fixed highlight/leader colour.
- alpha
Highlight opacity in
[0,1]. Leaders use the opaque colour. Character selections use unfilled cell outlines to preserve glyph contrast and residue colours, independently of this opacity.- highlight_width
Positive highlight band width in physical mm. Character panels instead follow the actual cell height.
- linewidth
Nonnegative leader width using the usual ggplot2 convention.
- linetype
Leader line type, default dashed.
- detail_box
Explicit detail allocation instead of side/detail_size, using the box convention in fusion_panel(). For multiple plots, supply a named list covering every detail. Physical boxes are rechecked at target size.
- allow_overlap
Deliberately permit overlapping containers, following ggchord_fusion(). Later panels cover earlier ones; default FALSE.
- center_box
Explicit source allocation instead of center_size.
- route
Direct boundary leaders (default), or avoid to route around measured other containers and native text/guide envelopes. Endpoints stay fixed; no clear route fails rather than hiding the selection.
- guides
Child legend placement, passed to
ggchord_fusion(). Default"keep"; use"collect"for shared native outside legends.- frame_region
Optional data frame with one row per region, in the same order, containing ordered positive source start/end coordinates. It changes only the source frame and leader departure points; region, detail data and the measured magnification ratio stay unchanged. NULL (default) uses the exact selected interval. Optional accver must match region. Each frame must be visible in the same source instance. Split origin-wrapping frames/selections into explicit intervals before using it.
Value
A ggchord_fusion() object. export_ggchord_fusion() additionally
returns focus_regions, focus_fronts and leaders in mm, plus original
focus_region_data (without metadata-name collisions), preserving the input
region, exact instances, source origins and sampled physical path-length ratio.
The derived tables use region_row to identify the original input row and
region_piece to identify the origin-split piece. The raw input stays intact.
Stat scope is recorded as explicit_detail_plot. Leaders do not appear in
connections or relationship_data. leader_paths contains the final decorative
polyline vertices. Routing is deterministic in measured physical space, not
a guarantee of globally optimal layout or automatic layer rebuilding. The measured ratio may be below one if the chosen
detail allocation does not enlarge the region.
Envelope leaders use their group's first region_row as the export key;
focus_regions$leader_group records that key for every member selection.
frame_start/frame_end record the displayed source frame independently of
start/end; explicit overrides are retained in focus_frame_region_data.
Details
Build detail_plot explicitly with focus_ggchord_data() or other documented
source-aware operations. This function does not copy/filter arbitrary layers
or silently choose a local/global Stat policy. The supplied detail plot owns
its data, mappings, statistics and labels. Original source origins, including
renamed/repeated focus windows, are used to resolve the same interval.
Examples
R · Example code
library(dplyr)
data(plasmid_example_pUC19)
whole <- ggchord(plasmid_example_pUC19) + geom_seq() + coord_circular()
region <- tibble(accver = "pUC19", start = 101, end = 1900)
local <- focus_ggchord_data(plasmid_example_pUC19, loci = region)
detail <- ggchord(local$seq_data) +
geom_seq() + coord_collinear(seq_axis = "vertical")
magnify_ggchord(whole, region, detail)
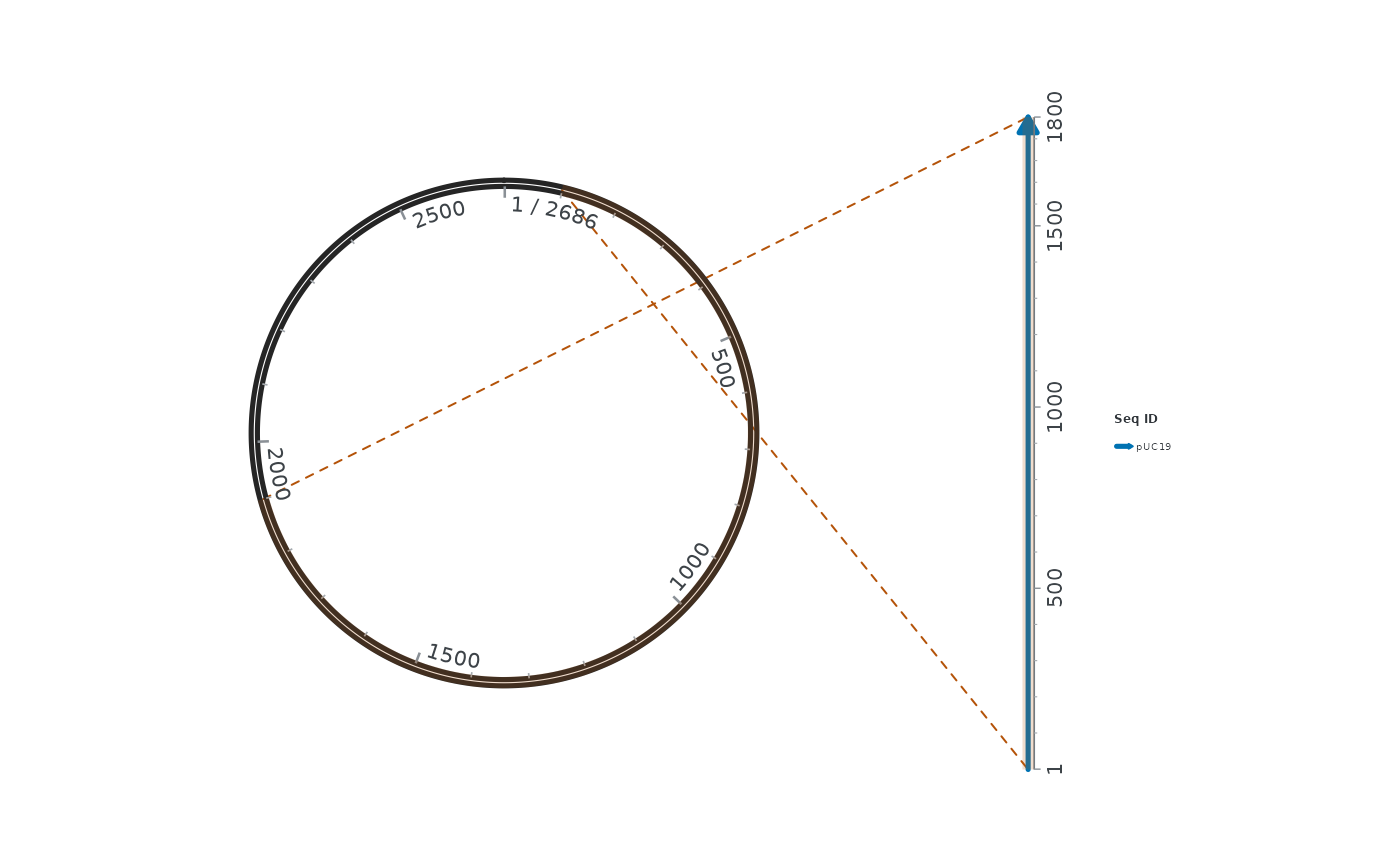 magnify_ggchord(whole, region, detail,
center_box = c(.02, .35, .2, .8), detail_box = c(.45, .98, .1, .9),
connector = "envelope")
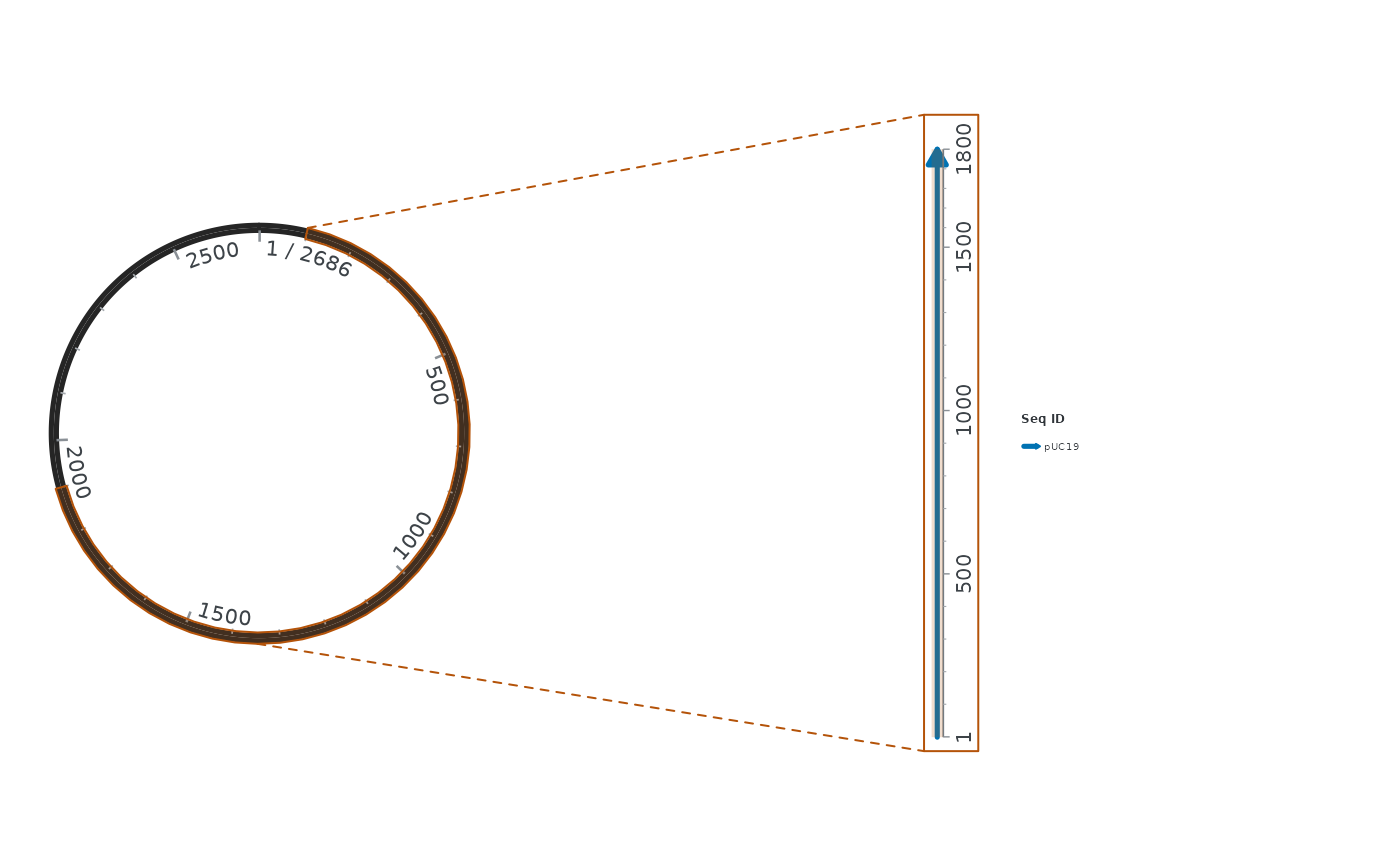 magnify_ggchord(whole, region, detail,
frame_region = tibble(start = 81, end = 1920))