Chapters and reference
Complete canonical API text; task articles explain the workflows. Usage guide

Draw a sequence-local data layer with ggplot2 grammar
Source:R/geom-track.R, R/track-grammar.R
geom_track.RdStatistics and data positions are calculated independently within each accession/window before projection into the physical track band. Supported geoms are point, line, path, step, col, bar, tile, rect, area, ribbon, segment, linerange, errorbar and text. Supported statistics are identity, count, bin, summary, smooth, density and ecdf; unsupported combinations fail in the native layer. Smooth/density/ecdf retain each estimation group's complete eligible source-row set, not new independent observations. These sets describe the group submitted to the native estimator, not per-point influence or a custom model's additional internal filtering decisions. Statistics operate on raw source x/y before Track numerical-scale transforms. ECDF requires explicit pad=FALSE because infinite anchors are not source positions. Density's native bounds argument is not forwarded: bounds here controls source-coordinate clipping, not density boundary correction. New estimation combinations use position="identity": smooth with line/path/point/ribbon, density with line/path/point/area, and ecdf with line/path/point/step. Other combinations are explicitly rejected. Count counts identical positions; bin requires explicit binwidth or breaks. An explicit group mapping takes priority over discrete style mappings. Bin source membership follows the native statistic, including outer edges and its numerical boundary tolerance, before data positions move the bars. Mapping x/y refers to source position/local numerical value, not screen x/y. Existing track_value/track_fill/track_colour roles remain accepted.
Usage
R · Example code
geom_track_bar(
  mapping = NULL,
  data = NULL,
  position = NULL,
  baseline = 0,
  fill = "#86AFB9",
  colour = NA,
  alpha = 1,
  linewidth = 0.25,
  linetype = 1,
  bounds = c("error", "clip"),
  show.legend = NA,
  inherit.aes = FALSE,
  ...
)

geom_track(
  mapping = NULL,
  data = NULL,
  geom = "point",
  stat = NULL,
  track = NULL,
  position = NULL,
  bounds = c("error", "clip"),
  baseline = 0,
  show.legend = NA,
  inherit.aes = FALSE,
  ...
)

geom_track_col(
  mapping = NULL,
  data = NULL,
  position = NULL,
  track = NULL,
  ...,
  show.legend = NA,
  inherit.aes = FALSE
)
Arguments
- mapping, data
Standard layer input. Supply accver and source positions through x/pos, or interval start/end. Map y/track_value for identity values.
- position
Data position such as identity, stack, dodge. The legacy position=position_track(...) spelling still declares the physical band.
- baseline
Numeric identity-column baseline. Nonzero baselines require position='identity' so stacking does not change their meaning.
- fill, colour, alpha, linewidth, linetype
Fixed styles for the count shortcut.
- bounds
Coordinate error/clip policy.
- show.legend, inherit.aes
Standard layer controls.
- ...
Native geom/stat parameters and fixed styles.
- geom, stat
Native geometry/statistic names. bar defaults to count; col and other geoms default to identity.
- track
A physical
position_track()declaration.
Examples
R · Example code
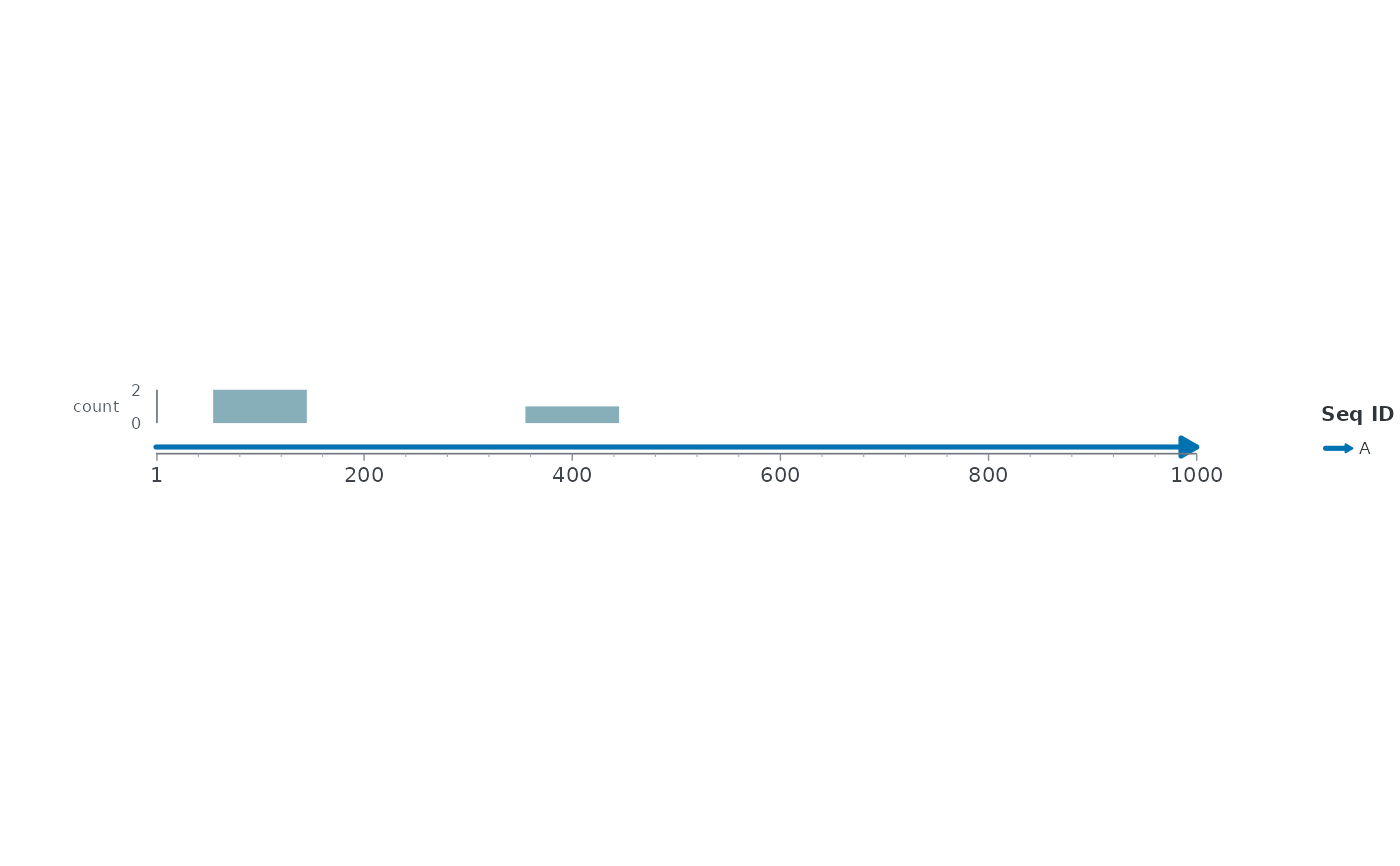
# Synthetic observations illustrate counting, not biological measurements.
events <- data.frame(accver = "A", pos = c(100, 100, 400))
ggchord(data.frame(accver = "A", length = 1000)) +
geom_seq() +
geom_track(data = events, geom = "bar", track = position_track("count")) +
coord_collinear()
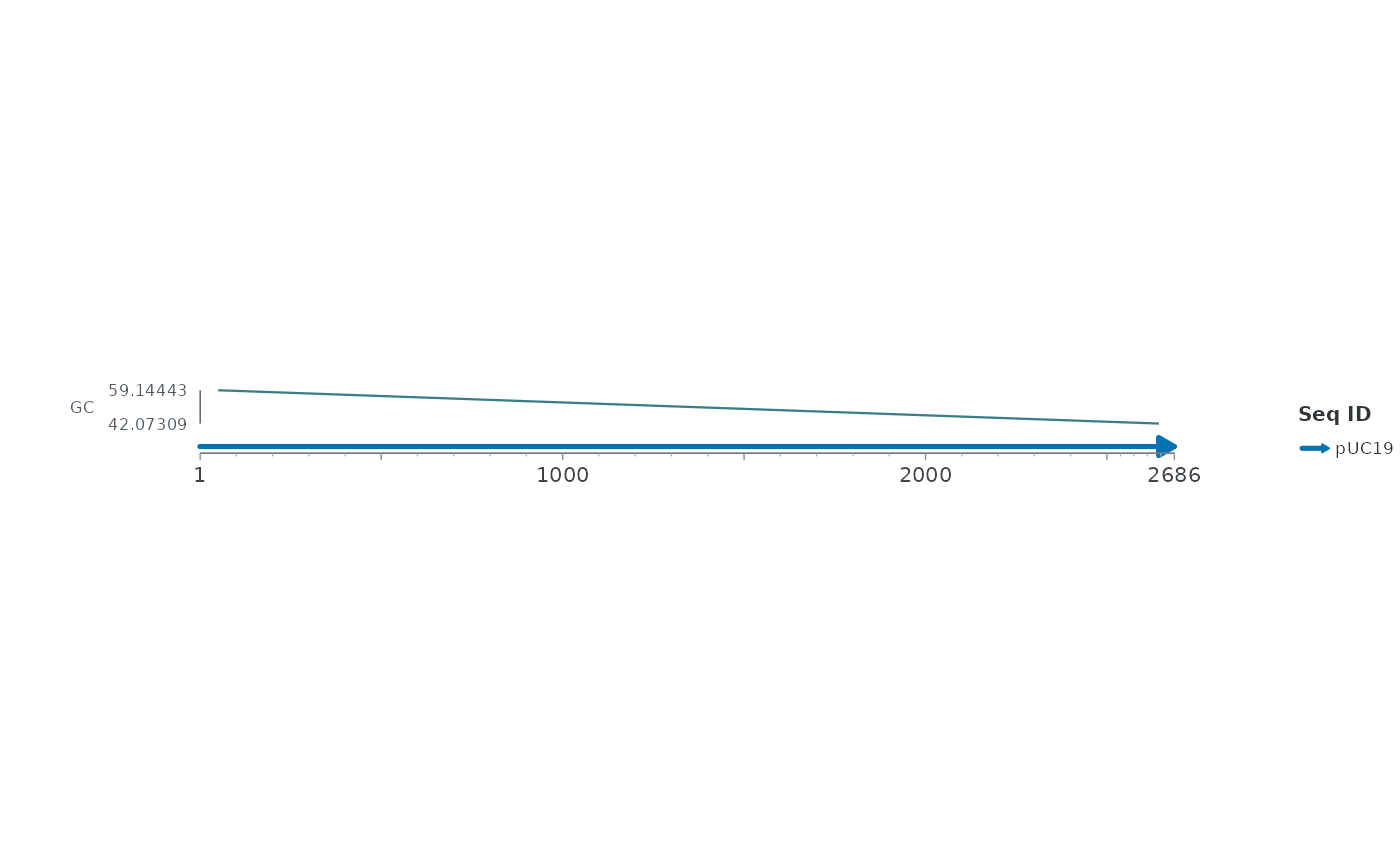
 # Fit existing GC windows in source space; estimates are not new data.
path <- system.file("extdata", "pUC19-gc-100.bedGraph", package = "ggchord")
signal <- read_bedgraph(path)
signal$pos <- (signal$start + signal$end) / 2
ggchord(data.frame(accver = "pUC19", length = 2686)) +
geom_seq() +
geom_track(aes(x = pos, y = value), data = signal, geom = "line",
stat = "smooth", method = "lm", formula = y ~ x, se = FALSE,
track = position_track("GC")) +
coord_collinear()