章节与参考
本页完整说明已译为现代汉语;函数、参数、代码和原始数据标识保留原样。 用法说明

每个 accession/窗口内独立计算统计与数据 Position,再投影到物理轨道带。支持 point、line、path、step、col、bar、tile、rect、area、ribbon、segment、linerange、errorbar 和 text;支持 identity、count、bin、summary、smooth、density 和 ecdf 统计,不支持的组合在原生层报错。smooth/density/ecdf 保留提交给原生估计器的完整有效组源行集合,不是新观测;该集合不表示每点影响或自定义模型内部进一步过滤的结果。统计使用原始源 x/y,在 Track 数值标度变换前执行。ECDF 必须显式 pad=FALSE,无限锚点不是源位置。bounds 是 Track 坐标裁剪策略,不转发原生 density 边界校正参数。新估计组合使用 position="identity":smooth 搭配 line/path/point/ribbon,density 搭配 line/path/point/area,ecdf 搭配 line/path/point/step,其他组合明确拒绝。count 对相同位置计数,bin 必须显式提供 binwidth 或 breaks。显式 group 映射优先于离散样式映射。分箱来源成员遵循原生统计的外边界及数值容差,在数据 Position 移动柱之前确定。x/y 表示源位置/局部数值,不是屏幕坐标;仍接受 track_value/track_fill/track_colour 角色。
用法
R · 示例代码
geom_track_bar(
  mapping = NULL,
  data = NULL,
  position = NULL,
  baseline = 0,
  fill = "#86AFB9",
  colour = NA,
  alpha = 1,
  linewidth = 0.25,
  linetype = 1,
  bounds = c("error", "clip"),
  show.legend = NA,
  inherit.aes = FALSE,
  ...
)

geom_track(
  mapping = NULL,
  data = NULL,
  geom = "point",
  stat = NULL,
  track = NULL,
  position = NULL,
  bounds = c("error", "clip"),
  baseline = 0,
  show.legend = NA,
  inherit.aes = FALSE,
  ...
)

geom_track_col(
  mapping = NULL,
  data = NULL,
  position = NULL,
  track = NULL,
  ...,
  show.legend = NA,
  inherit.aes = FALSE
)
参数
- mapping, data
标准图层输入。提供 accver,以及 x/pos 源位置或 start/end 区间;给定数值映射到 y/track_value。
- position
identity、stack、dodge 等数据 Position;旧 position=position_track(...) 写法仍声明物理 band。
- baseline
给定数值柱的基线,非零值要求 position='identity',避免堆叠改变其含义。
- fill, colour, alpha, linewidth, linetype
计数快捷层的固定样式。
- bounds
坐标报错或裁剪策略。
- show.legend, inherit.aes
标准图层控制参数。
- ...
原生 geom/stat 参数和固定样式。
- geom, stat
原生几何与统计名称,bar 默认 count,col 及其他几何默认 identity。
- track
物理
position_track()声明。
示例
R · 示例代码
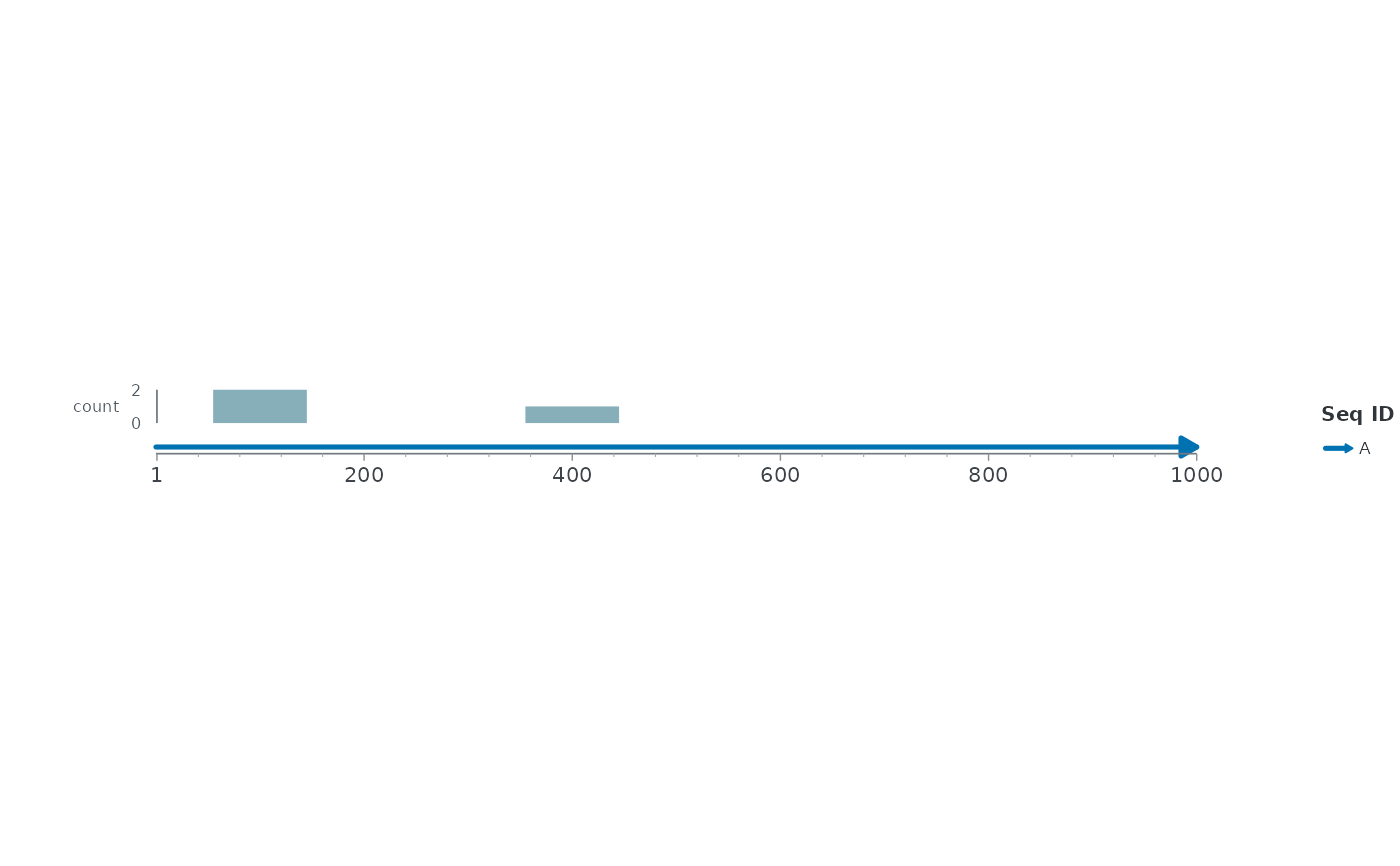
# 使用合成观测说明计数,不代表生物学测量。
events <- data.frame(accver = "A", pos = c(100, 100, 400))
ggchord(data.frame(accver = "A", length = 1000)) +
geom_seq() +
geom_track(data = events, geom = "bar", track = position_track("count")) +
coord_collinear()
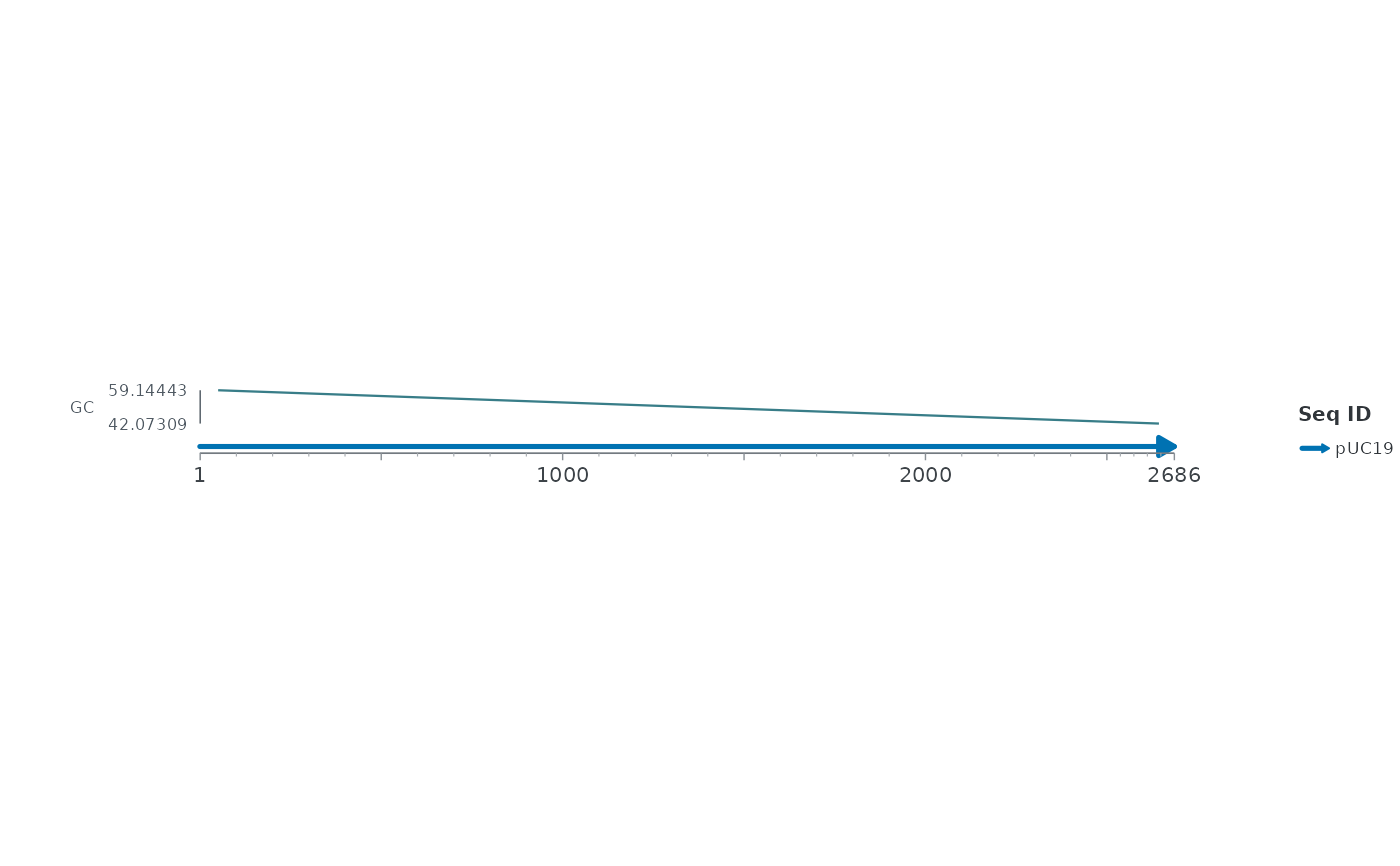
 # 在来源空间拟合已有 GC 窗口,估计值不作为新观测数据。
path <- system.file("extdata", "pUC19-gc-100.bedGraph", package = "ggchord")
signal <- read_bedgraph(path)
signal$pos <- (signal$start + signal$end) / 2
ggchord(data.frame(accver = "pUC19", length = 2686)) +
geom_seq() +
geom_track(aes(x = pos, y = value), data = signal, geom = "line",
stat = "smooth", method = "lm", formula = y ~ x, se = FALSE,
track = position_track("GC")) +
coord_collinear()