Chapters and reference
Complete canonical API text; task articles explain the workflows. Usage guide

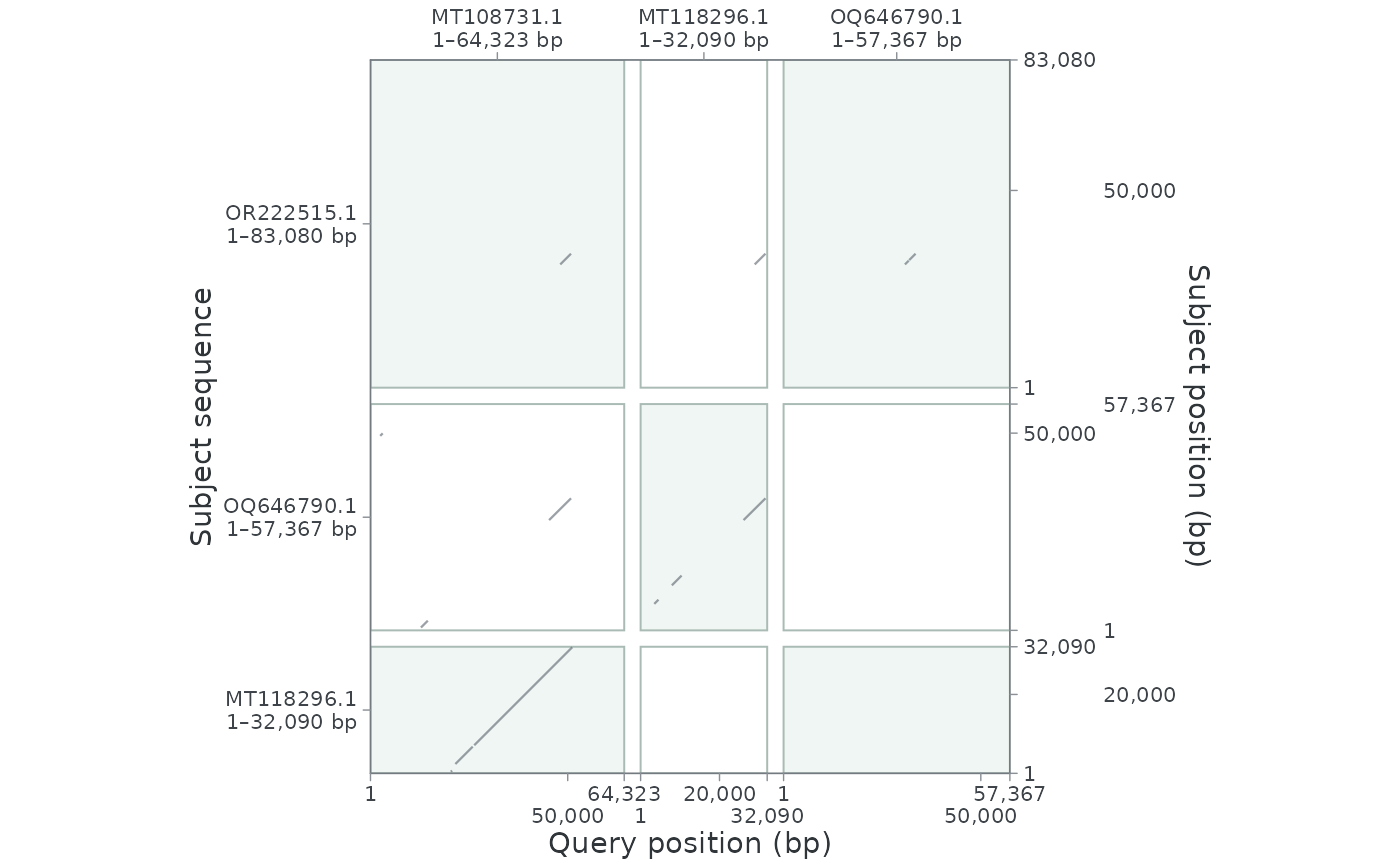
Query positions occupy x and subject positions occupy y. Each axis has
independently ordered sequence segments, optionally reversed for display.
Coordinates are one-based positions in native sequence units (bp or aa).
Concatenation gaps are display spacing, not omitted biological sequence.
No sequence backbone layer is required. Use geom_alignment_segment() to
display HSPs; other ggchord geometries and facets are not yet supported.
Standard ggplot2 annotations and explicit position scales remain available.
Usage
R · Example code
coord_dotplot(
  x_seqs = NULL,
  y_seqs = NULL,
  x_orientation = 1,
  y_orientation = 1,
  gap = NULL,
  ratio = 1,
  xlim = NULL,
  ylim = NULL,
  expand = FALSE,
  clip = "on"
)
Arguments
- x_seqs, y_seqs
Optional unique accession vectors in axis order. Defaults to the query/subject accessions occurring in alignment layers, or all sequences when there are no alignments. Rows outside a selected axis set are omitted and recorded; self and repeated HSP rows are retained.
- x_orientation, y_orientation
Display direction: 1 or -1, either a scalar or a vector named by every selected accession. Input is unchanged.
- gap
Nonnegative spacing in native sequence units between axis segments.
NULLuses five percent of the longest sequence.- ratio
Ratio of physical y units to physical x units, default 1.
- xlim, ylim
Optional global concatenated position limits. These zoom the panel without changing exported HSP endpoints.
- expand
Logical. Expand panel limits, default FALSE.
- clip
Panel clipping,
"on"(default) or"off".
Examples
R · Example code
data(seq_data_example)
data(ribbon_data_example)
ggchord(seq_data_example, ribbon_data_example) +
  geom_alignment_segment() +
  coord_dotplot()