Chapters and reference
Complete canonical API text; task articles explain the workflows. Usage guide
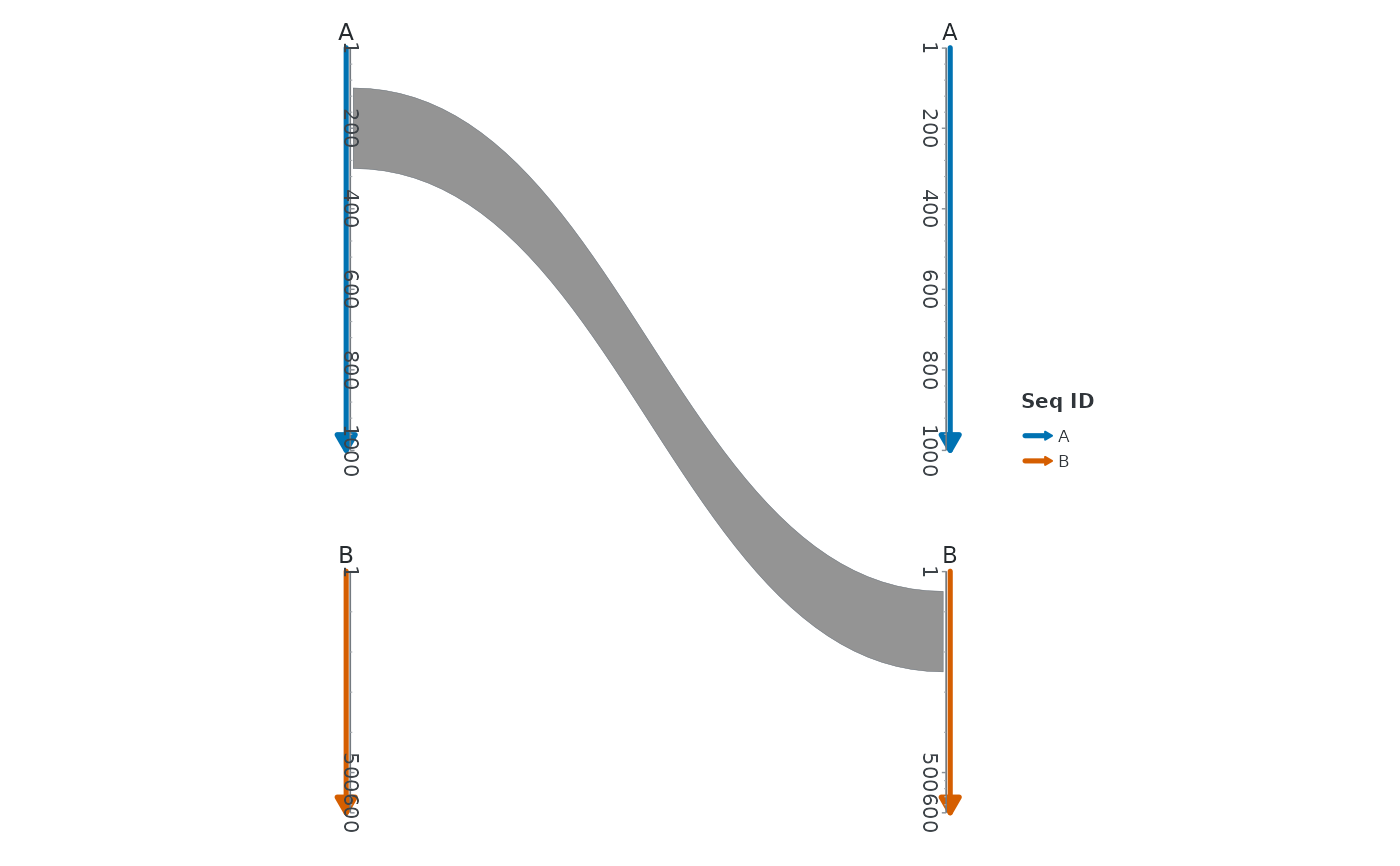
Each source sequence appears once in each column. Input query intervals connect from the left to subject intervals on the right; input reciprocal records remain distinct. This is not a multistage flow or a conservation law. Source lengths and both HSP endpoints determine the displayed interval widths.
Usage
R · Example code
coord_sankey(
  column_gap = 3,
  self_links = FALSE,
  ratio = 1,
  xlim = NULL,
  ylim = NULL,
  expand = FALSE,
  clip = "off",
  fit = c("labels", "geometry", "manual")
)
Arguments
- column_gap
Positive separation of the two backbones in layout units.
- self_links
Show relationships whose query and subject entity are equal.
- ratio
Fixed y/x aspect ratio, default 1.
- xlim, ylim
Optional user limits. Explicit limits take priority over automatically fitted limits.
- expand
Logical. Expand coordinate limits, default FALSE. Automatic fitting already includes a small safety margin; set TRUE to request the additional ggplot2 coordinate expansion.
- clip
Whether drawing is clipped to the panel, default
"off".- fit
Fitting strategy:
"labels"includes measured label boxes,"geometry"fits geometric elements only, and"manual"requires explicitxlimandylim.
Examples
R · Example code
# Synthetic intervals illustrate the mirrored layout.
s <- data.frame(accver = c("A", "B"), length = c(1000, 600))
h <- data.frame(qaccver = "A", saccver = "B",
  qstart = 100, qend = 300, sstart = 50, send = 250)
ggchord(s, h) + geom_seq() + geom_link_ribbon() +
  geom_seq_label() + coord_sankey()