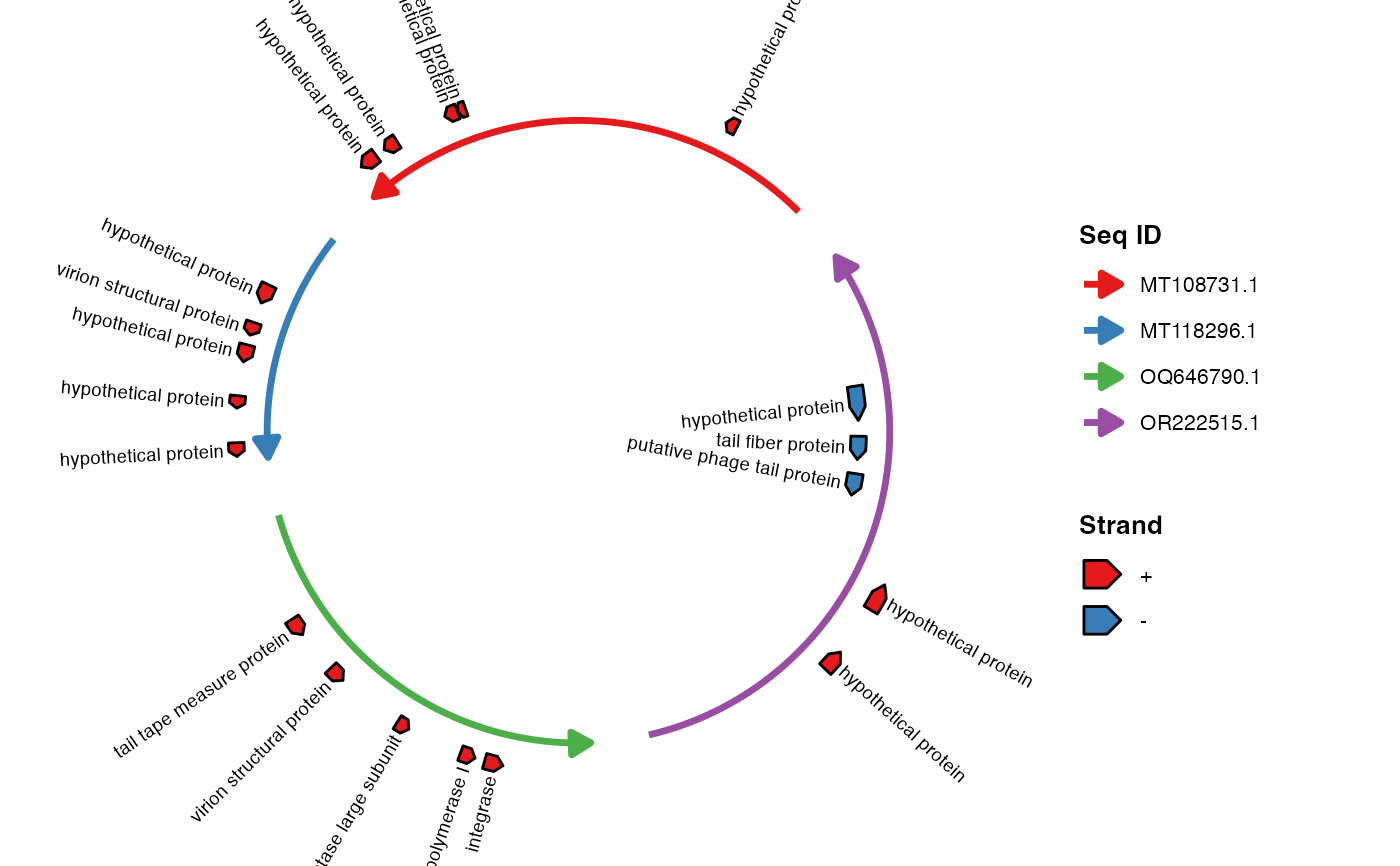
Draws the gene annotation labels on a chord diagram. This layer is
independent from geom_gene(): add it after geom_gene()
to annotate the gene arrows with their texts.
Usage
geom_gene_label(
  mapping = NULL,
  data = NULL,
  gene_label_size = NULL,
  gene_label_orientation = "horizontal",
  gene_label_side = "outside",
  gene_label_overlap = "hide",
  gene_label_rotation = NULL,
  gene_label_radial_offset = 0.04,
  gene_label_circum_offset = NULL,
  gene_label_circum_limit = NULL,
  gene_label_wrap = NULL,
  show_legend = FALSE,
  ...
)
Arguments
- mapping
Default NULL (uses pre-computed data)
- data
Default NULL (retrieved automatically from the layout)
- gene_label_size
Numeric. Label font size, default 2.5
- gene_label_orientation
Character, default
"horizontal". Text orientation relative to each sequence path:"radial","tangent", or"horizontal".- gene_label_side
Character, default
"outside". Place labels outside the chord, use the strand-based"auto"side, or force"inside"placement.- gene_label_overlap
Character, default
"hide". Fixed-label collision policy: omit later conflicting labels ("hide"), apply the legacy gentle adjustment ("nudge"), or keep all requested positions ("allow"). Input row order therefore provides a simple way to prioritize labels in"hide"mode.- gene_label_rotation
Optional numeric/vector/list. Label rotation angle, default 0
- gene_label_radial_offset
Optional numeric/vector/list. Radial offset of labels, default 0.04
- gene_label_circum_offset
Optional numeric/vector/list. Circumferential offset of labels, default 0
- gene_label_circum_limit
Optional logical/vector/list. Whether to limit circumferential offset, default TRUE
- gene_label_wrap
Numeric or NULL, default NULL. When set, long gene annotations are wrapped at this many characters (e.g. 15), which makes the labels narrower and less prone to overlap.
- show_legend
Whether to show the legend, default FALSE
- ...
Additional arguments passed to
geom_text()
Value
A list of ggplot2 layers. To let the labels avoid each other and the
genes (with leader lines), use geom_gene_label_repel()
instead.
Details
This is the deterministic, fixed-position label layer. By default labels
sit outside their sequence and labels that would collide are omitted in
input-row order. Use gene_label_overlap = "nudge" to retain the
legacy gentle adjustment, or "allow" to draw every label at its
requested position. For automatic arrangement with leader lines, use
geom_gene_label_repel() instead.