ggchord: A ggplot2-based tool for multi-sequence alignment chord plots
Source:R/ggchord.R
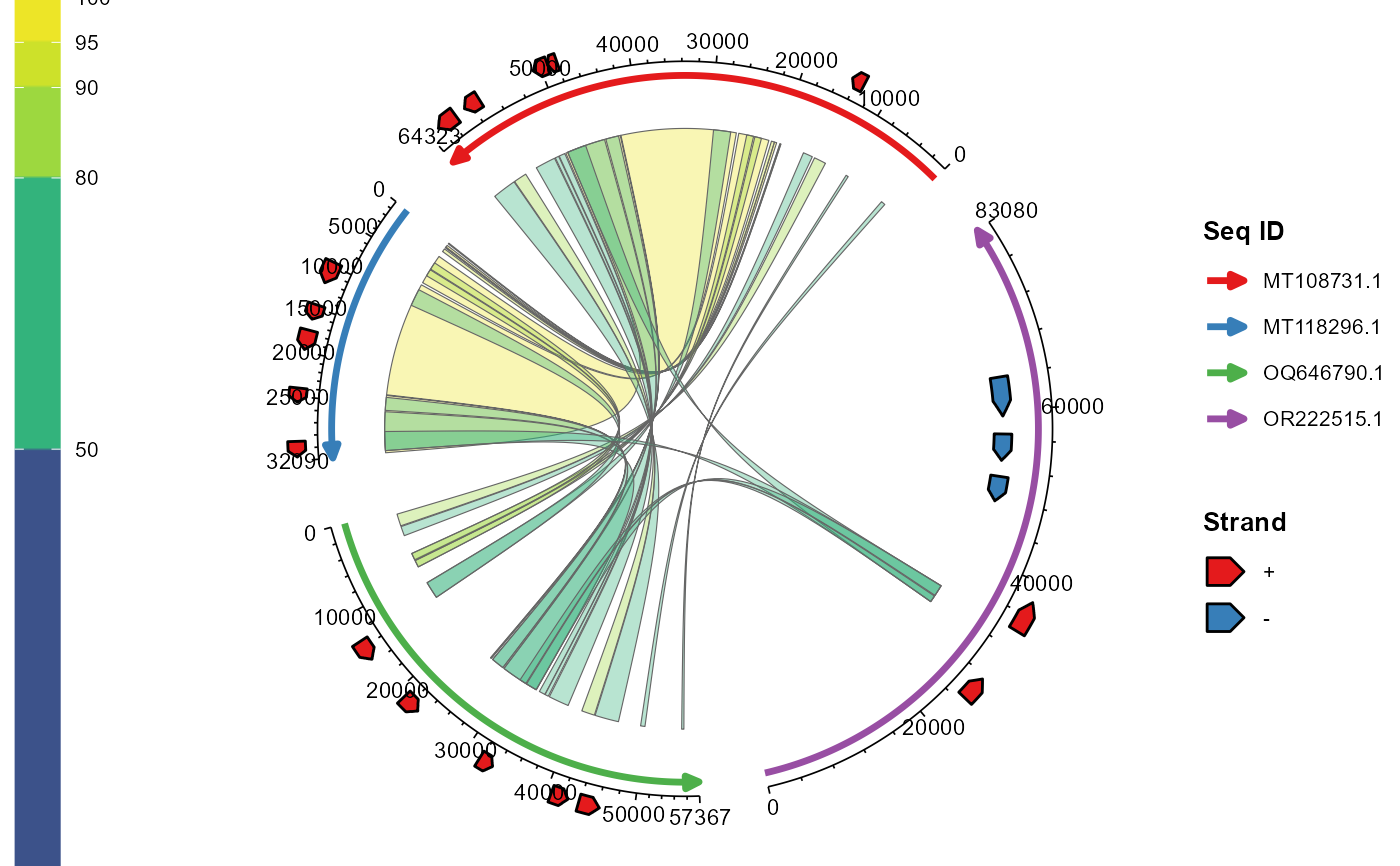
ggchord.Rdggchord is used to draw chord plots containing multiple sequences, which can display alignment relationships between sequences and gene annotation information. ggchord supports customizing various parameters such as sequence arrangement, colors, ribbon styles, and gene arrow styles, making it suitable for genome alignment visualization.
ggchord(
  seq_data,
  ribbon_data = NULL,
  gene_data = NULL,
  title = NULL,
  seq_order = NULL,
  seq_labels = NULL,
  seq_orientation = NULL,
  seq_gap = 0.03,
  seq_radius = 1,
  seq_colors = NULL,
  seq_curvature = 1,
  gene_offset = 0.1,
  gene_width = 0.05,
  gene_label_show = FALSE,
  gene_label_rotation = 0,
  gene_label_size = 2.5,
  gene_label_radial_offset = 0,
  gene_label_circum_offset = 0,
  gene_label_circum_limit = TRUE,
  gene_color_scheme = c("strand", "manual"),
  gene_colors = NULL,
  gene_order = NULL,
  ribbon_color_scheme = c("pident", "query", "single"),
  ribbon_colors = NULL,
  ribbon_alpha = 0.35,
  ribbon_ctrl_point = c(0, 0),
  ribbon_gap = 0.15,
  axis_gap = 0.04,
  axis_tick_major_number = 5,
  axis_tick_major_length = 0.02,
  axis_tick_minor_number = 4,
  axis_tick_minor_length = 0.01,
  axis_label_size = 3,
  axis_label_offset = 1.5,
  axis_label_orientation = "horizontal",
  rotation = 45,
  panel_margin = 0,
  show_legend = TRUE,
  show_axis = TRUE,
  debug = FALSE
)
Arguments
- seq_data
data.frame/tibble, required. A data frame containing basic sequence information, must include columns: - seq_id: Unique sequence identifier (character) - length: Sequence length (numeric, > 0)
- ribbon_data
data.frame/tibble, optional. BLAST alignment result data frame, must include columns: - qaccver: Query sequence ID (matching seq_id) - saccver: Subject sequence ID (matching seq_id) - length: Alignment length - pident: Percentage of sequence identity (0-100) - qstart/qend: Start/end positions of the query sequence in the alignment - sstart/send: Start/end positions of the subject sequence in the alignment
- gene_data
data.frame/tibble, optional. Gene annotation data frame, must include columns: - seq_id: ID of the associated sequence (matching seq_id) - start/end: Gene start/end positions (numeric) - strand: Strand direction (only "+" or "-") - anno: Gene annotation name (character)
- title
Character. Main title of the plot, default NULL (no title displayed)
- seq_order
Character vector, optional. Specifies the drawing order of sequences (must be a subset of seq_id), default follows the order in seq_data
- seq_labels
Character vector/named vector, optional. Sequence labels (length matching the number of sequences or named to match seq_id), default uses seq_id
- seq_orientation
Numeric (1 or -1), optional. Sequence direction (1 = forward, -1 = reverse), supports single value/vector/named vector, default 1
- seq_gap
Numeric (0 <= x < 0.5), optional. Proportion of gap between sequences, supports single value/vector/named vector, default 0.03
- seq_radius
Numeric (> 0), optional. Radius of sequence arcs, supports single value/vector/named vector, default 1.0
- seq_colors
Color vector/named vector, optional. Colors of sequence arcs, default auto-generated based on RColorBrewer Set1
- seq_curvature
Numeric, optional. Curvature of sequence arcs (0 = straight line, 1 = standard arc, > 1 = more curved), default 1.0
- gene_offset
Numeric/vector/list, optional. Radial offset of gene arrows from sequences (positive values outward, negative values inward), supports: - single value: shared by all sequences/strands - vector: length matching the number of sequences (assigned by sequence) - list: named list (elements are single values or vectors with "+"/"-" to distinguish strands), default 0.1
- gene_width
Numeric/vector/list, optional. Width of gene arrows, format same as gene_offset, default 0.05
- gene_label_show
Logical. Whether to display gene labels, default FALSE
- gene_label_rotation
Numeric/vector/list, optional. Rotation angle (degrees) of gene labels, format same as gene_offset, default 0
- gene_label_size
Numeric. Font size of gene labels, default 2.5
- gene_label_radial_offset
Numeric/vector/list, optional. Radial offset of gene labels relative to arrows, format same as gene_offset, default 0
- gene_label_circum_offset
Numeric/vector/list, optional. Circumferential offset proportion of gene labels along sequences, format same as gene_offset, default 0
- gene_label_circum_limit
Logical/vector/list, optional. Whether to limit circumferential offset to half the gene length, format same as gene_offset, default TRUE
- gene_color_scheme
Character. Color scheme for genes, optional "strand" (by strand direction) or "manual" (by annotation), default "strand"
- gene_colors
Color vector, optional. Fill colors for gene arrows, format depends on gene_color_scheme: - "strand": named vector ("+"/"-"), unnamed vector of length 1/2 - "manual": named vector (matching anno), unnamed vector (recycled), default auto-generated
- gene_order
Character vector, optional. Display order of genes in the legend (matching anno), default follows the order in data
- ribbon_color_scheme
Character. Color scheme for ribbons, optional "pident" (gradient by identity), "query" (by query sequence), "single" (uniform color), default "pident"
- ribbon_colors
Color vector, optional. Color parameters for ribbons: - "single": uniform color - "query": color vector matching seq_id - "pident": color gradient (at least 2 colors), default blue-to-yellow gradient
- ribbon_alpha
Numeric (0-1). Transparency of ribbons, default 0.35
- ribbon_ctrl_point
Vector/list, optional. Control points for Bézier curves (adjust ribbon shape): - vector: length 2 (single control point) or 4 (c1x,c1y,c2x,c2y for two control points) - list: each element is a sublist with 1-2 control points, default c(0,0)
- ribbon_gap
Numeric/vector/named vector, optional. Radial distance between sequences and ribbons, default 0.15
- axis_gap
Numeric/vector/named vector, optional. Radial distance between sequences and axes, default 0.04
- axis_tick_major_number
Integer/vector/named vector, optional. Number of major ticks, default 5
- axis_tick_major_length
Numeric/vector/named vector, optional. Length proportion of major ticks, default 0.02
- axis_tick_minor_number
Integer/vector/named vector, optional. Number of minor ticks per major tick, default 4
- axis_tick_minor_length
Numeric/vector/named vector, optional. Length proportion of minor ticks, default 0.01
- axis_label_size
Numeric/vector/named vector, optional. Font size of axis labels, default 3
- axis_label_offset
Numeric/vector/named vector, optional. Offset proportion of labels relative to ticks, default 1.5
- axis_label_orientation
Character/numeric/vector, optional. Orientation of axis labels: - "horizontal": horizontal - numeric: rotation angle (degrees) - vector: length matching the number of sequences or named vector (matching seq_id), default "horizontal"
- rotation
Numeric. Overall rotation angle of the plot (degrees), default 45
- panel_margin
Numeric/list, optional. Margin around the plot panel (t=top, r=right, b=bottom, l=left): - single value: same margin for all sides - list: named list (e.g., list(t=1,r=1)), default 0
- show_legend
Logical. Whether to display legends, default TRUE
- show_axis
Logical. Whether to display axes and ticks, default TRUE
- debug
Logical. Whether to output debugging information (e.g., number of valid ribbons), default FALSE
Value
A ggplot2 graph object, which can be further adjusted with ggplot2 functions
Examples
# Example code
p <- ggchord(
  seq_data = seq_data_example,
  ribbon_data = ribbon_data_example,
  gene_data = gene_data_example
)
print(p)