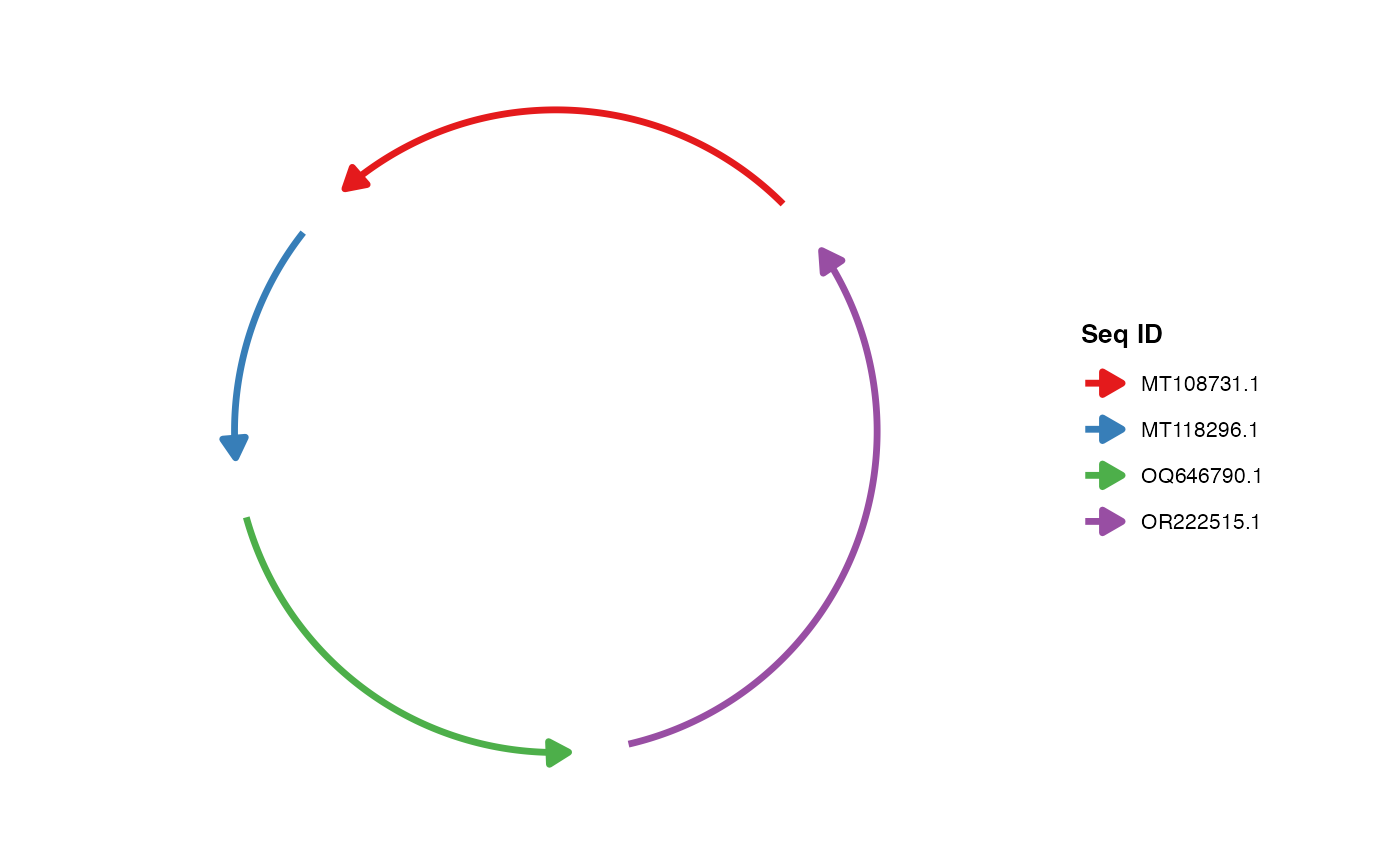
Draws arcs (or straight lines, depending on the curvature setting) representing sequences in the chord diagram. Sequence layout parameters (order, orientation, radius, curvature, colors, etc.) are specified here.
Usage
geom_seq(
  mapping = NULL,
  data = NULL,
  seq_order = NULL,
  seq_labels = NULL,
  seq_orientation = NULL,
  seq_gap = NULL,
  seq_radius = NULL,
  seq_curvature = NULL,
  seq_colors = NULL,
  linewidth = 0.9,
  show_legend = TRUE,
  legend_position = "right",
  ...
)
Arguments
- mapping
Default NULL (uses pre-computed data)
- data
Default NULL (retrieved automatically from the layout)
- seq_order
Optional character vector. Specifies the drawing order of sequences
- seq_labels
Optional character vector or named vector. Sequence labels
- seq_orientation
Optional numeric (1 or -1). Sequence orientation, default 1
- seq_gap
Optional numeric. Gap proportion between sequences, default 0.03
- seq_radius
Optional numeric (> 0). Sequence arc radius, default 1.0
- seq_curvature
Optional numeric. Arc curvature (0=straight, 1=standard arc, >1=more curved), default 1.0
- seq_colors
Optional color vector or named vector. Sequence colors
- linewidth
Arc line width, default 0.9
- show_legend
Whether to show the legend for this layer, default TRUE
- legend_position
Position of this layer's legend (the Seq ID legend): one of "left", "right", "top", "bottom" or "inside", default "right". Pass NULL to let the legend follow
theme(legend.position = ...)together with the other legends. Can also be set withtheme(legend.position.seq = ...).- ...
Additional arguments passed to
geom_path()