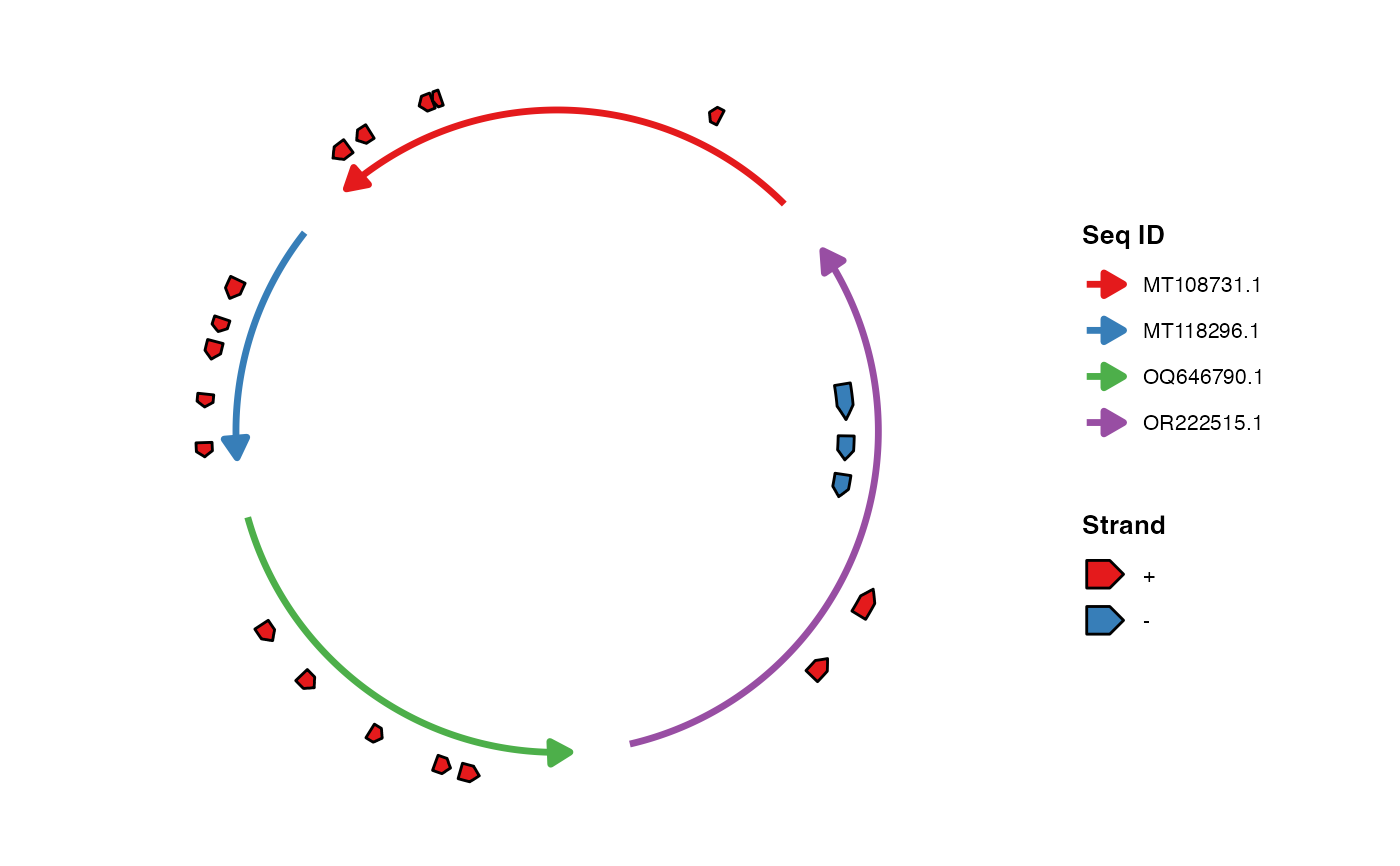
Draws gene annotation arrows on the chord diagram. Gene layout parameters (offset, width, color scheme, etc.) are specified here. The gene fill scale is kept independent from the ribbon's fill scale via a separate internal aesthetic used by the ribbon layer.
Usage
geom_gene(
  mapping = NULL,
  data = NULL,
  gene_offset = NULL,
  gene_width = NULL,
  gene_color_scheme = NULL,
  gene_colors = NULL,
  gene_order = NULL,
  show_legend = TRUE,
  legend_position = "right",
  ...
)
Arguments
- mapping
Default NULL (uses pre-computed data)
- data
Default NULL (retrieved automatically from the layout)
- gene_offset
Optional numeric/vector/list. Radial offset of gene arrows, default 0.1
- gene_width
Optional numeric/vector/list. Width of gene arrows, default 0.05
- gene_color_scheme
Character. "strand" or "manual", default "strand"
- gene_colors
Optional color vector. Fill color of gene arrows
- gene_order
Optional character vector. Display order of genes in the legend
- show_legend
Whether to show the legend, default TRUE
- legend_position
Position of this layer's legend (the Strand or Gene Annotation legend): one of "left", "right", "top", "bottom" or "inside", default "right". Pass NULL to let the legend follow
theme(legend.position = ...)together with the other legends.- ...
Additional arguments passed to
geom_polygon()
Value
A list of ggplot2 layers. To annotate the genes with their labels,
add a geom_gene_label() layer.