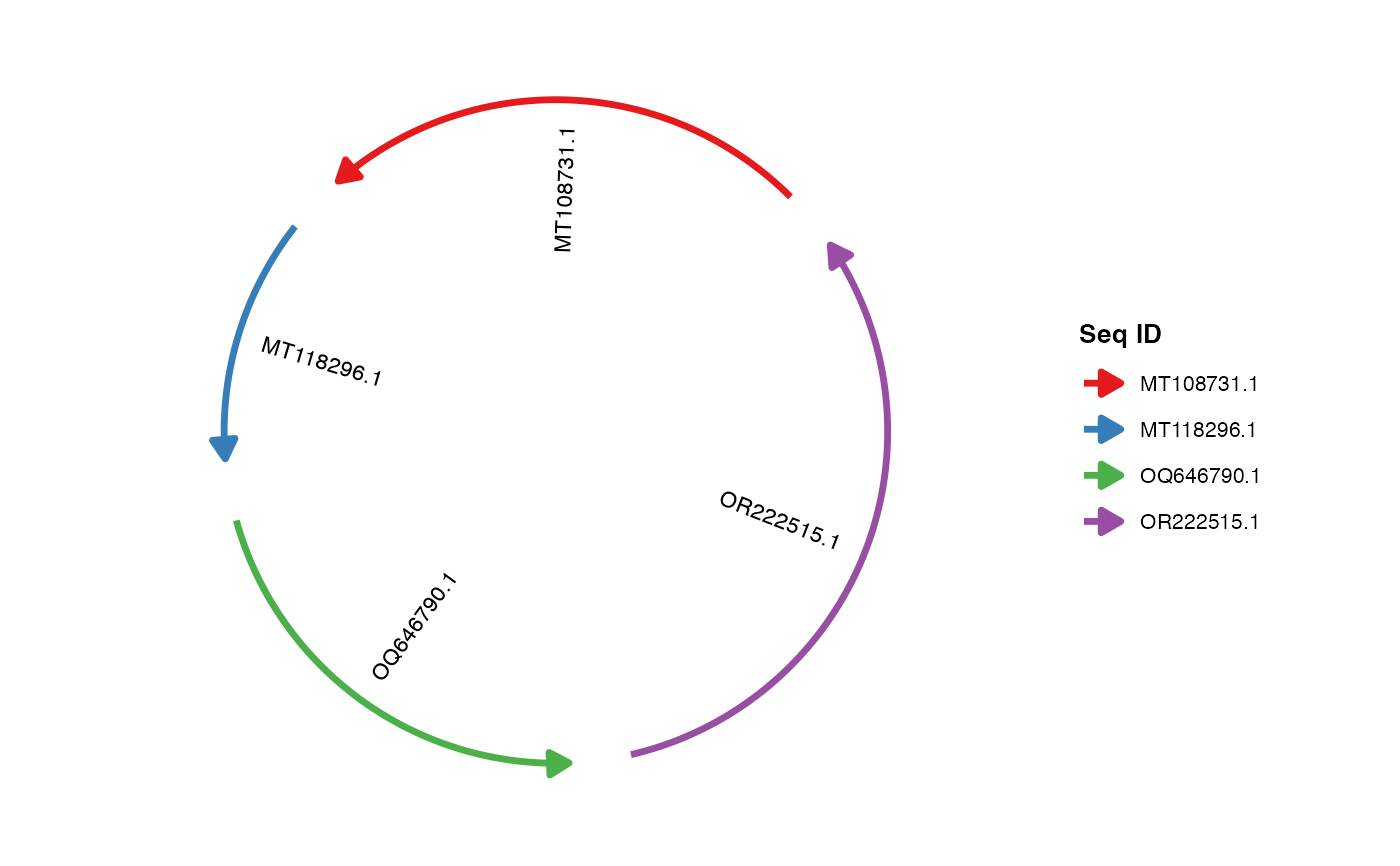
Places sequence labels at the midpoint of each sequence arc, radially offset from the arc. Labels can be styled via their radial offset, rotation, font size, text orientation and justification.
Usage
geom_seq_label(
  mapping = NULL,
  data = NULL,
  seq_label_radius = 1,
  seq_label_rotation = NULL,
  seq_label_size = NULL,
  labels = NULL,
  seq_labels = NULL,
  seq_label_orientation = c("arc", "horizontal"),
  seq_label_hjust = NULL,
  seq_label_vjust = NULL,
  check_overlap = FALSE,
  show_legend = FALSE,
  ...
)
Arguments
- mapping
Default NULL (uses pre-computed data)
- data
Default NULL (retrieved automatically from the layout)
- seq_label_radius
Optional numeric/vector. Radial position of the labels as a multiplier of the sequence arc radius:
1is on the arc,> 1places the label outside (away from the chord center) and< 1places it inside, default 1- seq_label_rotation
Optional numeric/vector. Additional label rotation (degrees) on top of the arc-aligned orientation, default NULL (0). Ignored when
seq_label_orientation = "horizontal".- seq_label_size
Optional numeric/vector. Label font size, default NULL (3)
- labels
Optional character vector. Override the label texts (defaults to the sequence labels from
geom_seq()or the sequence IDs)- seq_labels
Deprecated alias for
labels.- seq_label_orientation
Character, default "arc". Label text orientation:
"arc"rotates the text along the sequence arc (and keeps it readable),"horizontal"draws every label horizontally, extending away from the chord center.- seq_label_hjust
Optional numeric/vector. Horizontal justification of the labels, default NULL. The default arc orientation uses -0.2 so the text sits just inside the sequence; with
seq_label_orientation = "horizontal"the justification is chosen automatically so the text extends away from the chord center.- seq_label_vjust
Optional numeric/vector. Vertical justification of the labels, default NULL (0.5).
- check_overlap
Logical, default FALSE. When TRUE, labels that would overlap a previously drawn label are skipped (ggplot2's
geom_text()option).- show_legend
Whether to show the legend, default FALSE
- ...
Additional arguments passed to
geom_text()