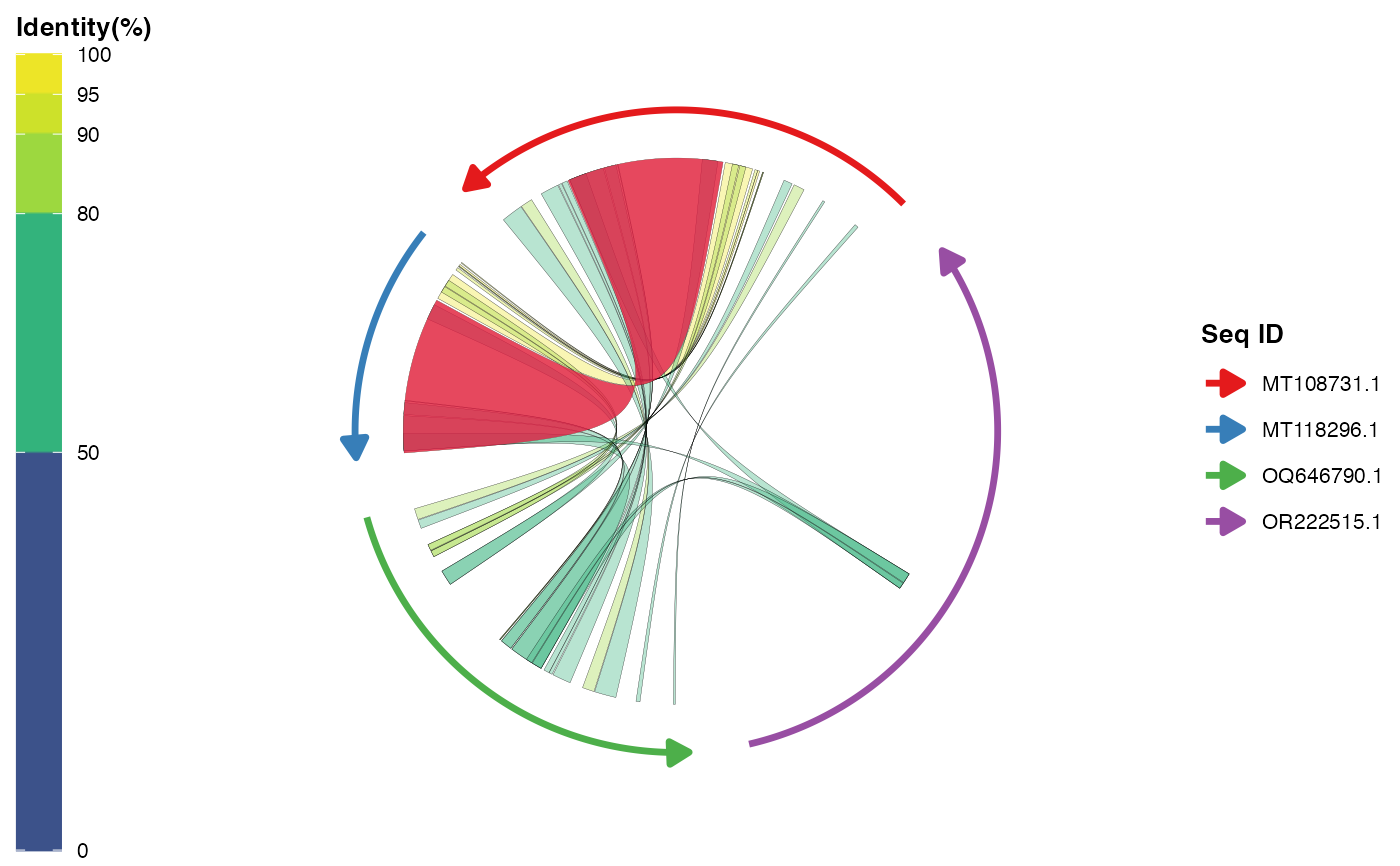
Draws a second polygon layer on top of selected ribbons so they can be emphasized without changing the underlying Identity( done with safe, explicit filters (row numbers, query/subject IDs, pident and length ranges) or a predicate function.
Usage
geom_ribbon_highlight(
  mapping = NULL,
  data = NULL,
  ribbon_ids = NULL,
  qaccver = NULL,
  saccver = NULL,
  min_pident = NULL,
  max_pident = NULL,
  min_length = NULL,
  max_length = NULL,
  predicate = NULL,
  highlight_color = "#C51B7D",
  highlight_alpha = 0.75,
  highlight_outline_color = NULL,
  highlight_outline_width = 0.3,
  show_legend = FALSE,
  ...
)
Arguments
- mapping
Default NULL (uses pre-computed data)
- data
Default NULL (retrieved automatically from the layout)
- ribbon_ids
Optional integer vector of original ribbon row numbers to highlight.
- qaccver
Optional character vector; only ribbons whose query ID is in this set are highlighted.
- saccver
Optional character vector; only ribbons whose subject ID is in this set are highlighted.
- min_pident
Optional numeric. Minimum percent identity.
- max_pident
Optional numeric. Maximum percent identity.
- min_length
Optional numeric. Minimum alignment length.
- max_length
Optional numeric. Maximum alignment length.
- predicate
Optional function taking the ribbon data.frame and returning a logical vector with one element per row. Evaluated safely (no string parsing).
- highlight_color
Character. Highlight fill colour, default
"#C51B7D".- highlight_alpha
Numeric (0-1). Highlight alpha, default 0.75.
- highlight_outline_color
Optional outline colour, default
NULL.- highlight_outline_width
Numeric. Outline width, default 0.3.
- show_legend
Logical. Whether to show a legend, default FALSE.
- ...
Additional arguments passed to
geom_polygon()