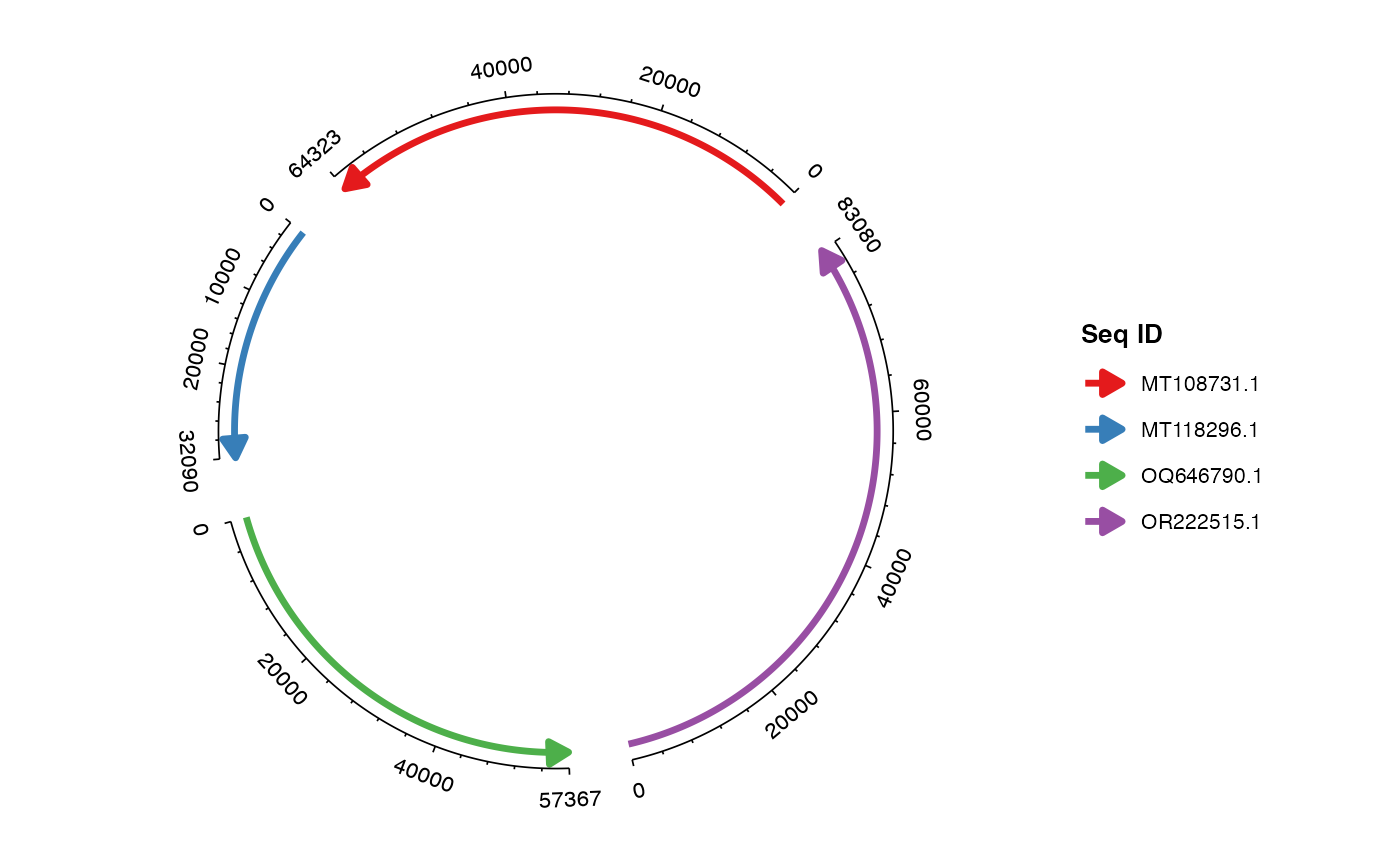
Draws axes for each sequence in the chord diagram (including axis lines, major/minor ticks, and labels). Axis parameters (spacing, tick count/length, label size/orientation, etc.) are specified here.
Usage
geom_axis(
  mapping = NULL,
  data = NULL,
  show_axis = NULL,
  axis_gap = NULL,
  axis_tick_major_number = NULL,
  axis_tick_major_length = NULL,
  axis_tick_minor_number = NULL,
  axis_tick_minor_length = NULL,
  axis_label_size = NULL,
  axis_label_offset = NULL,
  axis_label_orientation = NULL,
  axis_label_hide_overlaps = FALSE,
  line_params = list(),
  tick_params = list(),
  text_params = list(),
  ...
)
Arguments
- mapping
Default NULL (uses pre-computed data)
- data
Default NULL (retrieved automatically from the layout)
- show_axis
Logical. Whether to show the axis, default TRUE
- axis_gap
Optional numeric/vector. Spacing between sequence and axis, default 0.05
- axis_tick_major_number
Optional integer/vector. Number of major ticks, default 3
- axis_tick_major_length
Optional numeric/vector. Major tick length ratio, default 0.02
- axis_tick_minor_number
Optional integer/vector. Number of minor ticks, default 4
- axis_tick_minor_length
Optional numeric/vector. Minor tick length ratio, default 0.01
- axis_label_size
Optional numeric/vector. Tick label font size, default 3
- axis_label_offset
Optional numeric/vector. Label offset ratio, default 2
- axis_label_orientation
Optional character/numeric/vector. Label orientation, default "parallel". Accepted values: "horizontal" (text stays horizontal), "parallel" (text runs parallel to the axis, i.e. along the arc), "perpendicular" (text runs perpendicular to the axis, i.e. along the radial direction), or a numeric angle in degrees (ggplot2 convention: counter-clockwise from horizontal, in the final rendered plot space). A vector or named vector can be used to specify a different orientation per sequence.
- axis_label_hide_overlaps
Logical, default FALSE. When TRUE, axis labels whose boxes would overlap the plot content (sequence arcs, genes, ribbons) or other axis labels are automatically hidden.
- line_params, tick_params, text_params
Named lists of fixed style arguments for the axis path, tick segments and tick labels respectively. These override the corresponding `ggchord.axis.*` theme elements.
- ...
Shared fixed style arguments. `colour`, `alpha` and `na.rm` apply to all three components; line-specific and text-specific arguments are routed only to compatible geoms.